Sheep grazing impacts on soil health and pasture quality at Northeast solar sites
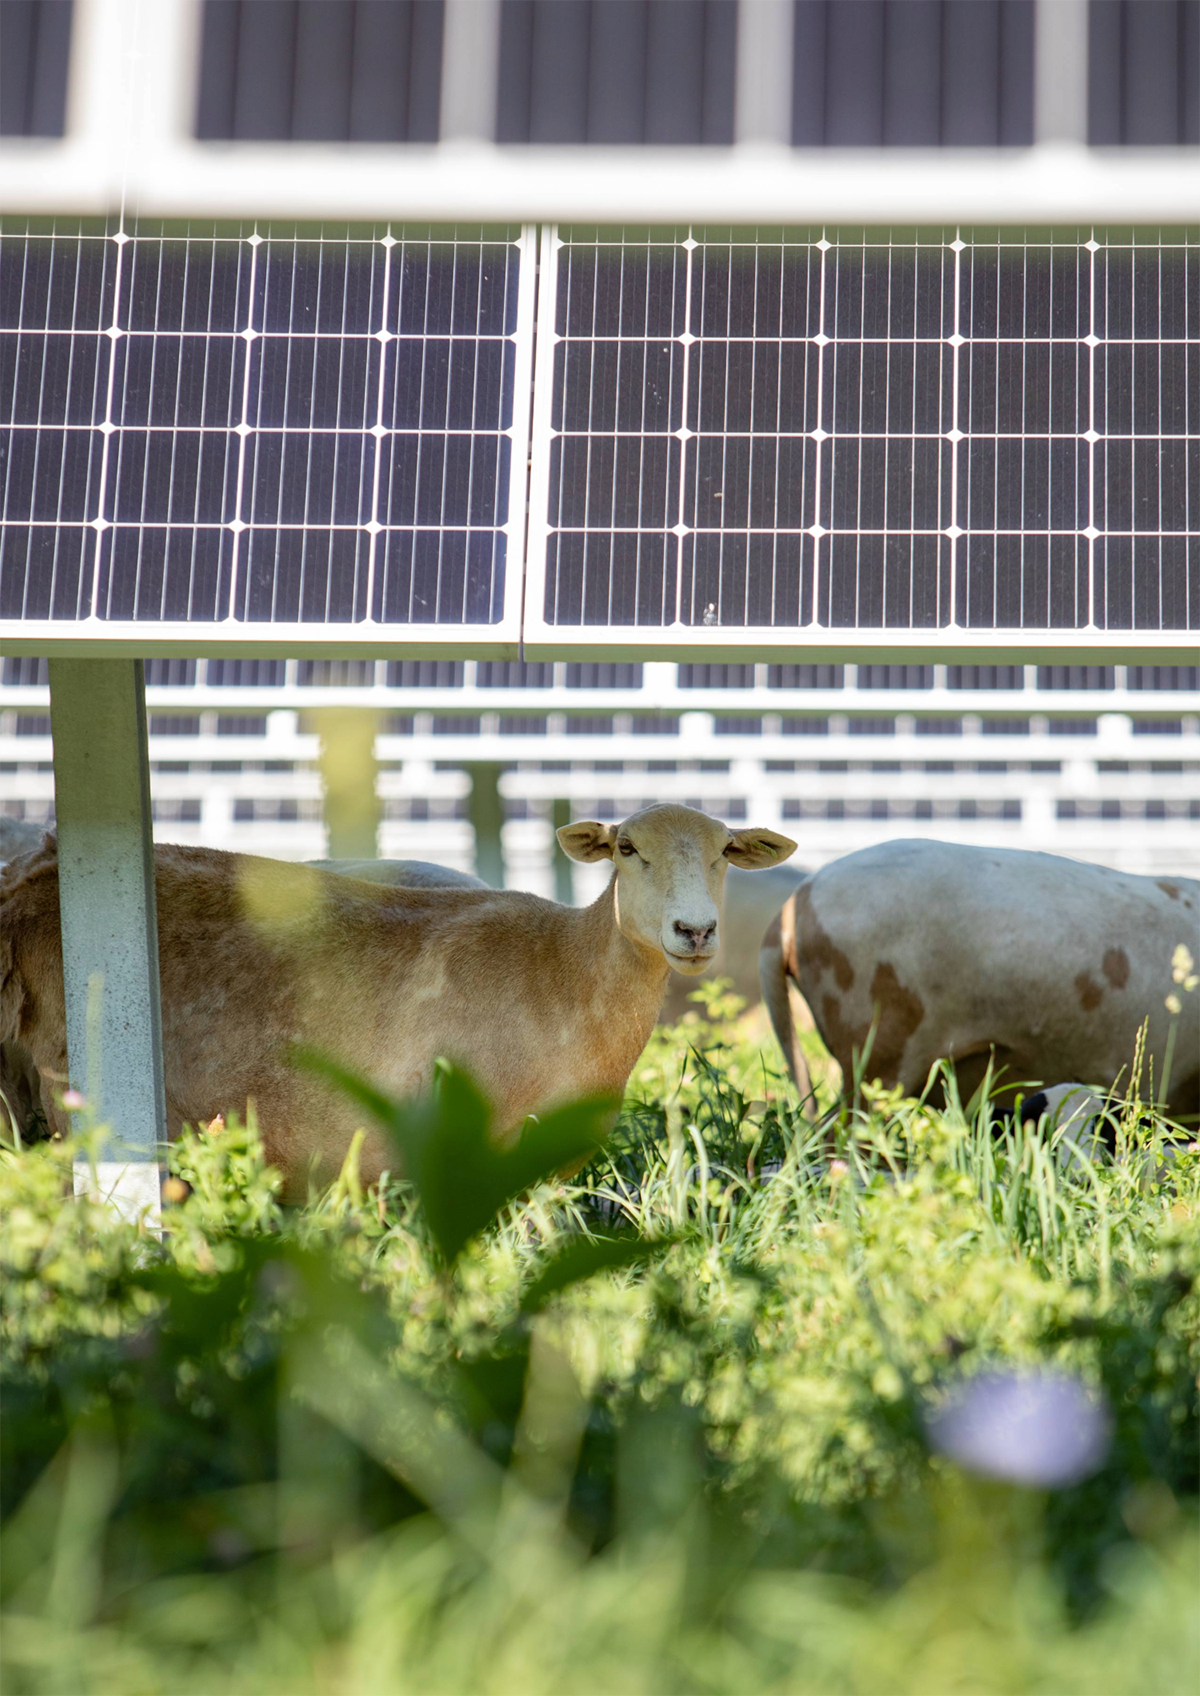

As solar energy development gains traction, there is a growing conflict in land use between solar site installations and farming in communities across the Northeastern U.S. One way to address this is by adapting agrivoltaics, a dual-use land strategy that combines agricultural and solar energy production. Solar grazing, which involves vegetation management with the use of livestock, has been a growing industry in the past decade. This study evaluated the effects of sheep grazing on soil health and pasture quality at 28 grazed and three non-grazed solar sites across the Northeastern U.S. Earn 1 CEU in Sustainability by reading this article and taking the quiz.
Solar photovoltaic (PV) energy generation plays an important role in the global effort to transition to energy production that prioritizes reducing greenhouse gas emissions, helping to mitigate negative impacts on climate. It is reported that solar PV has the potential to account for up to half of the total global electricity generation by the year 2050 (Nijsse et al., 2023). As solar energy development gains traction, there is a growing conflict in land use between solar site installations and farming in communities across the Northeastern U.S. The states in this study have policies and initiatives that require an increase in renewable energy development, which are accelerating the pace of this conflict. In order to reach these renewable energy goals and sustain agriculture, new solutions and compromises are being pursued.
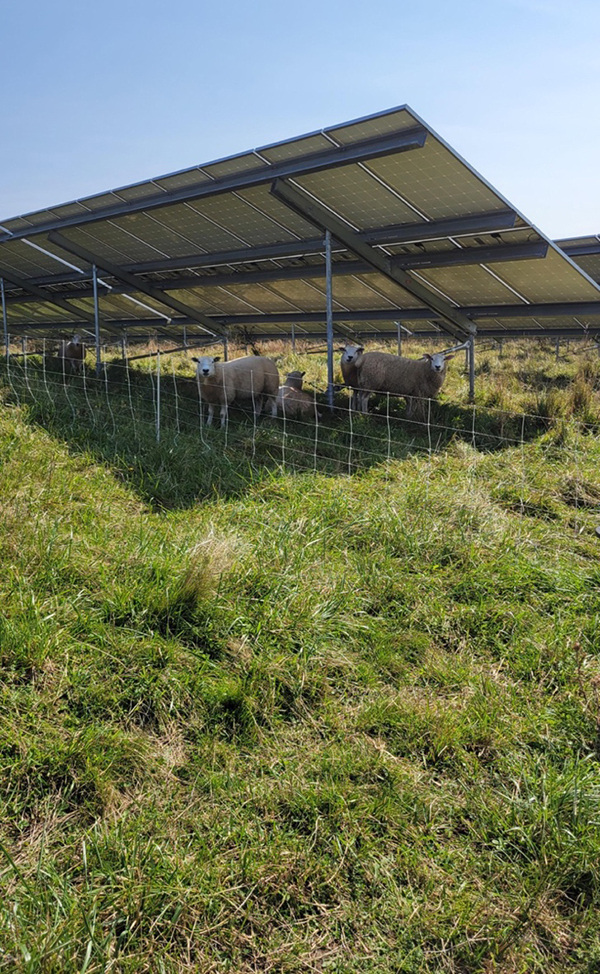
One way to address this is by adapting agrivoltaics, a dual-use land strategy that combines agricultural and solar energy production (Figure 1). Solar grazing, which involves vegetation management with the use of livestock, has been a growing industry in the past decade (Kochendoerfer & Thonney, 2021). Past research on solar grazing has largely focused on behavior and liveweight gain; however, there is limited research on how this popular agrivoltaic approach influences forage nutrient quality, soil health, and overall ecosystem health (Andrew et al., 2021; Sharpe et al., 2021; Maia et al., 2020).
In 2018, the first Cornell Atkinson Center-funded research project involved one solar array and the health and well-being of sheep followed by a survey for solar operators across Northeastern U.S. (Kochendoerfer et al., 2019). The study was preliminary and lacked information that could guide solar professionals or farmers going forward. As such, the purpose of this study was to collect in-field data on how solar sheep grazing influences soil health, associated ecosystem health, forage nutritive quality, and pasture conditions at 28 grazed and three non-grazed commercial solar sites in the Northeastern U.S. The sites and their history are described within the Materials and Methods section. Our preliminary analysis of this data from 2022 and 2024 suggests solar grazing can enhance forage quality and impact soil health parameters in multiple ways.
Materials and methods
This study was conducted to compare pasture quality and soil health at commercial solar sites with and without sheep grazing for vegetation management. The study was performed at 28 grazed solar sites and three non-grazed sites with sample collection beginning in spring 2022 and completed summer 2024. The sites were located primarily in New York with a total of 25 sites in the state but also included three locations in Pennsylvania, two locations in Connecticut, and one location in Massachusetts. The sites ranged from 3.5 to 38 ac with one site being 99 ac. Twenty-nine sites used fixed panels while the remaining two sites used single-axis tracking panels.
Sites were constructed between 2015–2020. The majority reported prior land use of the sites was croplands (including hay and corn), followed by open fields (including fallow land), and finally woodlands. When selecting sites, graziers were sought out who were already solar grazing as a form of agrivoltaics. As such, the solar sites were constructed for the purpose of energy generation with local graziers later joining the operation to create agrivoltaic sites, allowing for this baseline research to take place. Sites were selected by their ability to contribute to the knowledge base over the duration of the study and provide relevant information about innovative co-location strategies as well as by the willingness of all parties involved in the solar site maintenance to share information.
All soil and forage samples were collected at both the non-grazed and grazed sites. Additionally, these samples were collected in areas under solar panels (UP) and in open space (OS) areas without direct shade from the panels.
Pasture conditions were measured only on grazed sites using Pasture Condition Scoring (PCS). Pasture Condition Scoring was recorded following the USDA-NRCS Pasture Condition Scoring Sheet in the summer pre-grazing season and again in the fall post-grazing season for each year at each grazed site (USDA-NRCS, 2020).
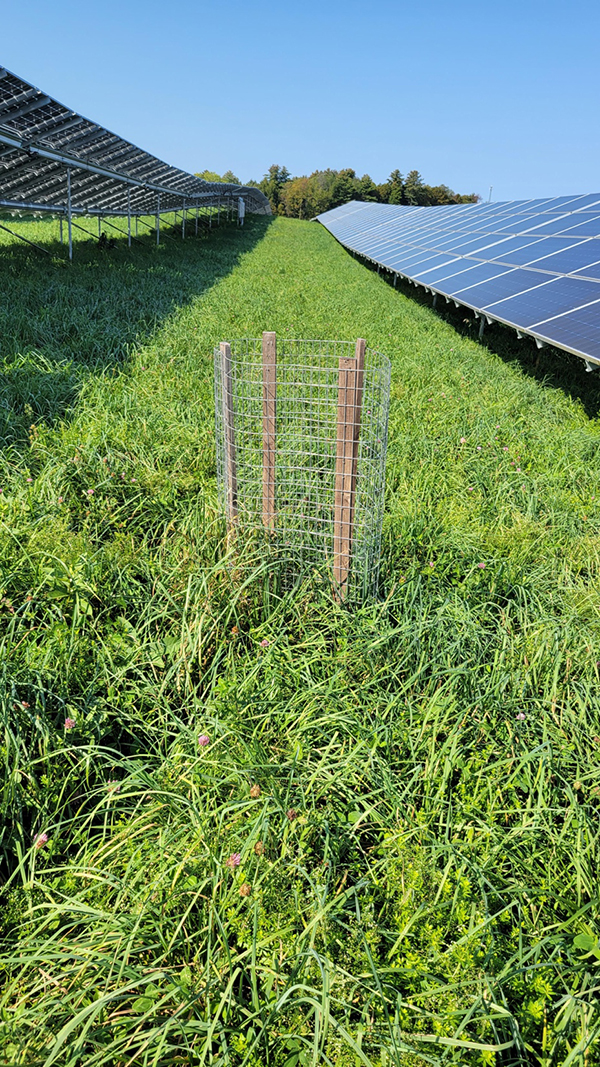
Two individual exclusion cages measuring 24 inches were placed at each grazed and non-grazed site with one in the UP treatment and one in the OS treatment (Figure 2). These cages served as controls to the portions of the solar site that are grazed to compare the relative productivity between grazed and non-grazed sites. The cages were harvested in the summer and fall of each year by using electric shears or harvest knives to cut the forage to 7–10 cm above soil level. The sample was then weighed and sent to Dairy One Forage Laboratory to undergo forage analysis (Dairy One, 2025). Following harvest, a new area was pre-cut, and the exclusion cage was re-installed to prepare for the next sampling date.
Soil health was monitored by collecting topsoil (0–15 cm) and subsoil (15–30 cm) samples in the pre-grazing season from the OS and UP treatments at grazed and non-grazed sites, resulting in four composite samples per site. GPS coordinates were identified to ensure the same location was monitored each year. A main location was selected, and four subsamples were collected around the main location, resulting in one composite sample created by five subsamples.
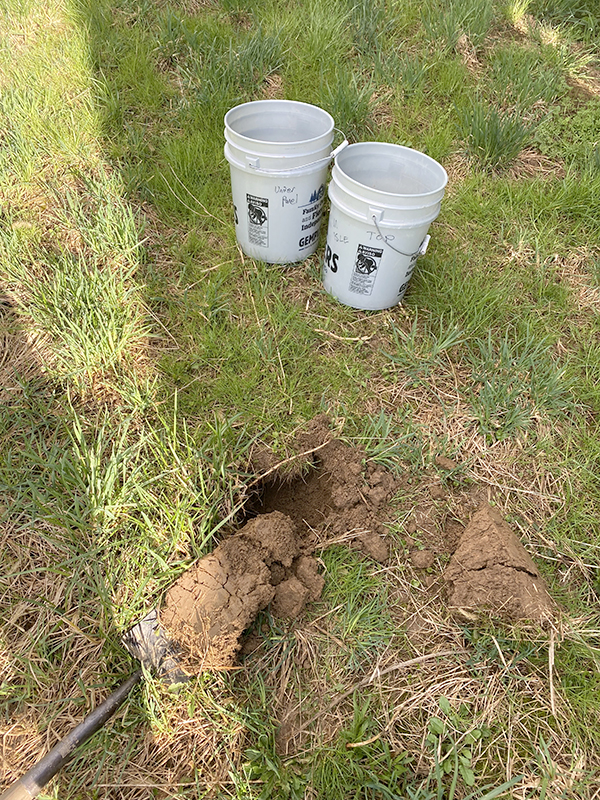
To collect the samples, a hole was dug approximately 30 cm deep. A vertical, rectangular slice of soil was taken from one side of the hole, measuring approximately 5 cm x 15 cm x 8 cm. The subsamples for each treatment were placed in a clean bucket, thoroughly mixed, and 32–40 oz of the composite sample was sent to Cornell Soil Health Laboratory to undergo analysis (Cornell Soil Health Laboratory, 2025).
Results and discussion
Pasture condition scoring
There was not a significant difference (p=0.07) between the total pasture condition scores (PCS) between 2022 and 2023 with values of 33.01 and 34.83 out of 50, respectively. A high PCS value reflects a well-managed site with plant and animal productivity being sustained or enhanced. According to the USDA-NRCS scoring guidelines, the PCS values reported for 2022 and 2023 suggest that the productivity and/or the environment at the sites would benefit from further improving the site (USDA-NRCS, 2020). The lower scores seen in 2022 may have resulted from drought conditions during the testing period. Despite the difference in total PCS scores not being statistically significant, the increase in 2023 shows that grazing may have the potential to improve solar site pasture quality over time. The 2023 scores were at the verge of falling into the next PCS tier of 35–45, which involves only minor changes to enhance the site (USDA-NRCS, 2020).
It is important to note that several categories are used to determine PCS, and a high or low value in one of these categories can influence the overall PCS value. In most cases, there was no significant difference between yearly seasons (Table 1). Individual scoring categories that experienced the most statistical difference between seasons were livestock concentration areas in the fall (p<0.001), soil compaction in the spring (p<0.001), and plant vigor in both fall (p<0.001) and spring (p<0.001). For most cases, the PCS values increased, demonstrating improved site conditions.
| Fall 2022 (n=21) | Fall 2023 (n=25) | P- value | Spring 2022 (n=25) | Spring 2023 (n=21) | Spring 2024 (n=27) | P- Value | ||
|---|---|---|---|---|---|---|---|---|
| Percent desirable plants | 3.52 | 3.62 | .79 | 3.88 | 3.45 | 3.56 | .39 | |
| Percent legumes by dry weight | 1.76 | 2.10 | .41 | 2.40 | 1.38 | 1.65 | .06 | |
| Live plant cover | 3.28 | 3.88 | .02 | 3.32 | 3.48 | 3.63 | .43 | |
| Plant diversity | 3.52 | 3.62 | .79 | 3.88 | 3.45 | 3.56 | .39 | |
| Plant residue | 3.17 | 3.66 | .06 | 3.08 | 3.33 | 3.13 | .49 | |
| Grazing utilization | 4.00 | 3.50 | .12 | 3.83 | 3.40 | 4.25 | .04 | |
| Livestock concentration areas | 3.52 | 4.24 | <.001 | 3.88 | 3.92 | 4.44 | .03 | |
| Soil compaction | 3.21 | 3.44 | .43 | 2.92 | 3.17 | 3.65 | <.001 | |
| Plant vigor | 3.32 | 4.26 | <.001 | 3.48 | 4.07 | 4.17 | <.001 | |
| Erosion | 3.98 | 4.46 | .03 | 4.08 | 4.12 | 4.24 | .75 |
To attempt to avoid a large difference in values between OS areas and UP areas, most of our sites were calculated by determining PCS values in the OS and UP areas individually. However, this data wasn’t collected at every site. For those sites that were unable to be measured this way, a score that was representative of the whole site was recorded. For sites with two separate PCS values, we combined the values and averaged them to reflect conditions between and under panels (AVG) PCS value. This equal weighting of values approach was appropriate due to the row spacings of the solar panels. By including AVG PCS results, we were able to compare results across all study sites, as seen in Table 1.
Open space had significantly (p<0.001) higher scores for erosion, correlating with less observed evidence of erosion, than UP and the AVG scores (p=0.01). It is suggested from some previous modeling results that solar panels may increase erosion due to the higher energy and velocity of water draining from the panels, causing soil erosion below the panels (Yavari et al., 2022). This phenomenon may account for the lower erosions scores seen in UP areas. However, despite the lower scores in the UP area, there was no overall significant differences in erosion when adjusted for the season (Table 1).
Effects of solar panels on forage quality
Forages harvested from UP in 2023 had significantly higher crude protein (CP) content and significantly better digestibility than those values observed in OS areas (Table 2). This suggests that grazing sites may experience enhanced forage quality when agrivoltaics are incorporated as the shading effects from the panels provided higher quality forage in 2023. Crude protein was significantly higher in all seasons and years (p<0.001) when harvested from UP (Table 2). This is supported by existing literature that found higher CP in shaded areas (Lin et al., 2001). Non-digestible fiber content, measured as acid detergent fiber (ADF), was significantly lower (p=0.02) when harvested from UP in fall 2023 (Table 2). Another measure of digestibility, neutral detergent fiber (aNDF), was significantly lower (p=0.03) in the UP treatment in fall 2023 (Table 2). The higher CP and lower aNDF under panels are consistent with previous solar grazing studies (Andrew et al., 2021).
| Forage nutritive test | Summer 2022 (n=59) | Summer 2023 (n=54) | Fall 2022 (n=54) | Fall 2023 (n=58) | ||||||||
|---|---|---|---|---|---|---|---|---|---|---|---|---|
| P-value | OS | UP | P-value | OS | UP | P-value | OS | UP | P-value | OS | UP | |
| ADF | 0.11 | 38.89 | 37.42 | 0.14 | 37.51 | 35.81 | 0.63 | 38.86 | 36.40 | 0.02 | 37.41 | 34.28 |
| aNDF | 0.41 | 62.28 | 61.10 | 0.70 | 60.20 | 59.00 | 0.74 | 58.23 | 57.54 | 0.03 | 58.60 | 53.83 |
| CP | <0.001 | 10.54 | 16.06 | <0.001 | 10.48 | 15.17 | <0.001 | 15.24 | 17.93 | <0.001 | 14.40 | 19.53 |
Effects of grazing on soil health
Averaged between the two years, soil organic matter at grazed sites tended to (p=0.06) be significantly greater than non-grazed sites with average values being 4.14 and 3.70%, respectively (Table 3). It is worth mentioning that the sample size of non-grazed sites was much smaller (n=18) than grazed sites (n=143). Soil pH was also significantly (p=0.01) higher in grazed sites than non-grazed sites with an average of 6.20 and 5.81, respectively (Table 3).
Grazed (SG) or non-grazed (NG) | Open space (OS) or under panel (UP) | |||||
|---|---|---|---|---|---|---|
| Soil test | SG (n=143) | NG (n=18) | P-value | OS (n=81) | UP (n=80) | P-value |
| Percent organic matter | 4.14 | 3.70 | 0.06 | 4.12 | 4.05 | 0.75 |
| pH | 6.20 | 5.81 | 0.01 | 6.20 | 6.12 | 0.53 |
The higher soil organic matter and pH values in grazed sites demonstrates the potential for solar grazing to improve solar site soil health. Larger soil organic matter values help to reduce soil compatibility (Soane, 1990). Additionally, grazing allows for soil pH to reach near-optimal soil pH levels (optimal=6.0; AHDB, 2023).
Conclusions
This study demonstrates the ability of solar grazed agrivoltaic systems to have the potential to enhance forage quality and improve soil health. Crude protein and lower aNDF values for 2023 in UP areas suggested a higher forage quality for shaded areas present in agrivoltaic systems. Additionally, while not statistically significant, an increase in overall PCS values was seen in 2023, showing that grazing may improve pasture quality over time. Grazed solar sites contained higher soil organic matter and pH levels, suggesting grazing may have the ability to continually improve soil health at solar sites. Overall, solar sheep grazing helps to create a beneficial dual-use environment.
Limitations and future directions
A noticeable limitation to this study is the short sampling time frame. Some benefits from improved soil health may take 5–10 years to become measurable, demonstrating that it is possible that this short-term study is not fully capturing the change in soil health (USDA-NRCS, 2022). Furthermore, this study relied on voluntary site access and occurred in several different states. This created the challenge of ensuring consistency, both with sampling dates and with having a controlled location and environment. Planning for a potential follow-up data collection in the future would prove beneficial while using this initial work to establish a baseline.
This article was originally published as part of the 2024 AgriVoltaics Conference Proceedings. It is republished here in a slightly modified format under Creative Commons License 4.0 (CC BY 4.0). Figures 3 and 4 were omitted in this version along with the statements on data availability, author contributions, competing interests, funding, and acknowledgement, which can viewed in the original version.
AHDB. (2023). Nutrient management guide (RB209): Section 1 principles of nutrient management and fertilizer use. Agriculture and Horticulture Development Board. https://ahdb.org.uk/knowledge-library/rb209-section-1-principles-of-nutrient-management-and-fertiliser-use
Andrew, A.C., Higgins, C.W., Smallman, M.A., Graham, M., & Ates, S. (2021). Herbage yield, lamb growth and foraging behavior in agrivoltaic production system. Frontiers in Sustainable Food Systems, 5, 659175. https://doi.org/10.3389/fsufs.2021.659175
Cornell Soil Health Laboratory. (2025). Testing services. Cornell University. https://soilhealthlab.cals.cornell.edu/testing-services/
Dairy One. (2025). Submitting a sample. Dairy One Forage Lab Services. https://dairyone.com/services/forage-laboratory-services/submitting-a-sample/
Kochendoerfer, N., & Thonney, M.L. (2021). Grazing sheep on solar sites in New York State: Opportunities and challenges. American Solar Grazing Association. https://solargrazing.org/wp-content/uploads/2021/02/Solar-Site-Sheep-Grazing-in-NY.pdf
Kochendoerfer, N., Hain, A., & Thonney, M. (2019). The agricultural, economic and environmental potential of co-locating utility scale solar with grazing sheep. Atkinson Center for a Sustainable Future. https://solargrazing.org/wp-content/uploads/2021/02/Atkinson-Center-Full-Report.pdf
Lin, C.H., McGraw, M.L., George, M.F., & Garrett, H.E. (2001). Nutritive quality and morphological development under partial shade of some forage species with agroforestry potential. Agroforestry Systems, 53, 269–281. https://doi.org/10.1023/A:1013323409839
Maia, A.S.C., Culhari, E.A., Fonsêca, C.F.C., Milan, H.F.M., & Gebremedhin, K.G. (2020). Photovoltaic panels as shading resources for livestock. Journal of Cleaner Production, 258, 120551. https://doi.org/10.1016/j.jclepro.2020.120551
Nijsse, F.J.M., Mercure, J.F., Ameli, N., Larosa, F., Kothari, S., Rickman, J., Vercoulen, P., & Pollitt, H. (2023). The momentum of the solar energy transition. Nature Communications, 14, 6542. https://doi.org/10.1038/s41467-023-41971-7
Sharpe, K.T., Heins, B.J., Buchanan, E.S., & Reese, M.H. (2021). Evaluation of solar photovoltaic systems to shade cows in a pasture-based dairy herd. Journal of Dairy Science, 104, 2794–2806. https://doi.org/10.3168/jds.2020-18821
Soane, B.D. (1990). The role of organic matter in soil compactibility: A review of some practical aspects. Soil Tillage Research, 16, 179–201. https://doi.org/10.1016/0167-1987(90)90029-D
USDA-NRCS. (2020). Natural Resources Conservation Service guide to pasture condition scoring. USDA-NRCS, Washington, DC. https://www.nrcs.usda.gov/sites/default/files/2022-06/National_Pasture_Condition_Scoring_Guide_and_Score_Sheet_-_January_2020.pdf
USDA-NRCS. (2022). NRCS soil health journey factsheet. USDA-NRCS, Washington, DC. https://www.nrcs.usda.gov/sites/default/files/2022-08/NRCS%20Soil%20Health%20Journey%20factsheet_FINAL.pdf
Yavari, R., Zaliwciw, D., Cibin, R., & McPhillips, L. (2022). Minimizing environmental impacts of solar farms: A review of current science on landscape hydrology and guidance on stormwater management. Environmental Research: Infrastructure and Sustainability, 2, 035002. https://doi.org/10.1088/2634-4505/ac76dd
Self-study CEU quiz
Earn 1 CEU in Sustainability by taking the quiz for the article. For your convenience, the quiz is printed below. The CEU can be purchased individually, or you can access as part of your Online Classroom Subscription.
Which of the following forage characteristics improved under solar panels?
a. Fiber concentration.
b. Crude protein content.
c. Nitrate accumulation.
d. Leaf lignin content.- In addition to crude protein, forage under solar panels also showed improvement in
a. palatability index.
b. digestibility.
c. carbohydrate storage.
d. stem length.
3. Sheep grazing under solar panels was associated with improvements in soil organic matter.
a. True.
b. False.
4. Which soil chemical property increased at grazed sites relative to non-grazed ones?
a. Potassium.
b. Calcium.
c. pH.
d. Phosphorus.
5. What is the primary land-use strategy being supported by the study’s findings?
a. Intercropping.
b. Polyculture.
c. Agrivoltaics.
d. Urban agriculture.
6. Which of the following best describes the forage quality under solar grazing systems?
a. Higher protein and digestibility.
b. Lower nutrient content but higher yield.
c. Greater weed infestation.
d. Reduced palatability for livestock.
7. Which factor likely contributed to the improvement of soil health in grazed solar sites?
a. Reduced irrigation.
b. Fertilizer applications.
c. Panel shade effects.
d. Sheep manure and grazing activity.
8. Forage grown under solar panels was found to have lower crude protein content than forage grown in open pasture.
a. True.
b. False.
9. Grazed solar sites showed higher values of which soil health property compared with non-grazed sites?
a. Bulk density.
b. Electrical conductivity.
c. Soil organic matter.
d. Sodium content.
10. What dual benefit does agrivoltaics provide according to the study?
a. Reduced farm labor and increased electricity costs.
b. Improved forage quality and enhanced soil health.
c. Higher solar efficiency and more fertilizer use.
d. Decreased biodiversity and reduced land productivity.
Text © . The authors. CC BY-NC-ND 4.0. Except where otherwise noted, images are subject to copyright. Any reuse without express permission from the copyright owner is prohibited.


