Ensuring reliable agronomic lab results: a practical guide

Agronomic lab results rely on three key pillars: representative sampling, accurate and precise laboratory analysis, and science-based interpretation. This article provides practical guidelines for preventing contamination, capturing variability, ensuring laboratory quality control, and using validated, research-backed correlations. By strengthening all three areas, agronomists can turn raw lab data into trustworthy, profitable decisions for crop and soil management. This article was prepared as a contribution of the Western Region Nutrient Management Coordinating Committee (WERA-103). Earn 0.5 CEUs in Soil & Water Management by reading this article and taking the quiz.
Reliable agronomic recommendations begin long before a lab report lands on your desk. Every trustworthy lab result depends on three equally critical pillars:
- A truly representative sample
- Accurate, precise laboratory analysis
- Science-based interpretation of results
Below is a streamlined checklist—grounded in research and field experience—for each pillar.
1. Representative sampling
“Garbage in, garbage out” has never been truer than in lab work. No level of analytic brilliance can rescue a compromised sample.
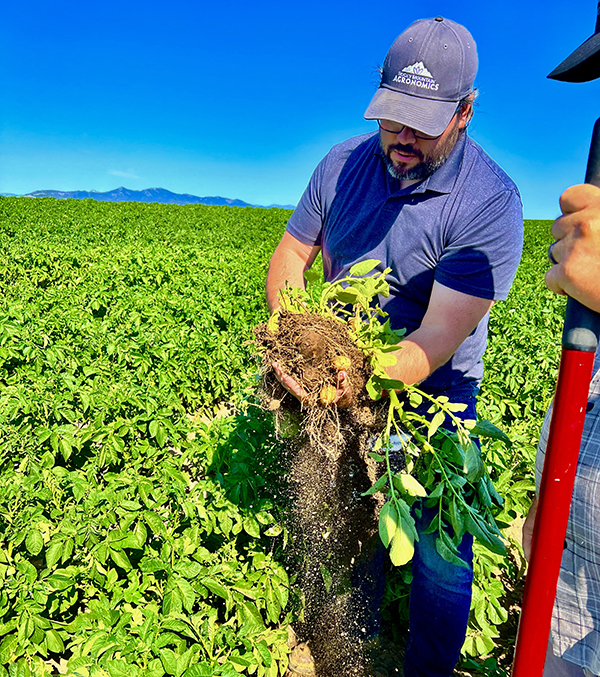
Keep contaminants out
- Use reasonably clean tools and containers.
- Avoid contamination from fertilizers or other residues on gloves, buckets, or other equipment.
- Fabric sample bags provide ventilation but must be stored away from moisture and potential contamination—including avoiding cross-contamination if excess moisture carries solutes from one sample to another.
- Lightly rinse plant tissue to remove dust, particularly when testing for micronutrients (especially iron).
- For irrigation water, let the system pump for several minutes before collecting a sample.
Capture variability
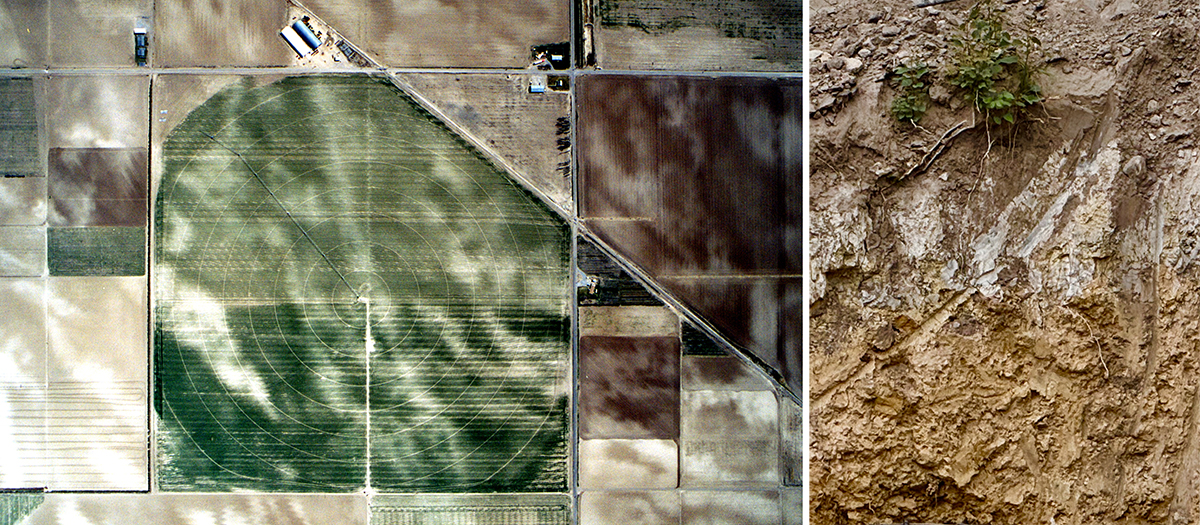
Soil, plant, and water samples can vary significantly across space, depth, and time (Table 1). To avoid misleading lab results, one of following approaches must be taken with regard to address this variability:
a. Average the variability. Use a composite sample to reflect the average condition across space or depth—such as taking a 4-ft-deep sample to assess nitrate-nitrogen for sugar beets.
b. Measure the variability. Collect multiple separate samples to assess variation directly—such as with grid or zone sampling, segmented depth sampling, and/or repeated sampling across the season.
c. Isolate one aspect. Focus intentionally on a specific area, depth, or timing to monitor a targeted zone or moment—such as sampling only topsoil in one area before planting.
Dimension | Why it matters | Field tips |
|---|---|---|
| Space (spatial) | Properties can vary significantly across spatial areas due to landscape position, management zones, or past inputs. | Take random subsamples across the area to be represented, avoiding unusual zones (e.g., field edges, wet spots, poor yielding, etc.). Combine a minimum of 6–8 subsamples per sample; increase this as the size of the area increases. Also increase this for plant samples with small plant parts. For example, 15 soil cores may be needed for a composite from a large uniform area while 8 cores generally suffice for grid- or zone-sampling points. |
Depth/ height | Nutrient concentrations and other properties often shift with depth. | For soil, the topsoil is typically sampled but be aware of variability within and between horizons—such as pH or phosphorus stratification in no-till systems. In plant samples, nutrient levels can differ by plant part and height. For water, particularly in stagnant or layered ponds, chemistry can shift with depth. When depth matters, collect and label separate samples for each layer. |
| Time (temporal) | Analytical values often change over time. | Properties shift with weather, crop growth, microbial activity, irrigation, and recent nutrient/amendment applications. For example, warming temperatures can increase nutrient mineralization in soil, and nutrient levels differ between older and newer plant tissues. Irrigation water quality may change as sources deplete, or flow rates fluctuate. To ensure consistency and comparability, sample at the same crop stage or seasonal window used in calibration studies. For water, target key flow periods such as spring runoff or summer low flow. |
Sample handling
- Follow the lab’s instructions for sample size, container type, labeling, and shipping.
- Label each sample clearly with waterproof tags or markers—include sample name or ID, location, and date.
- Pack samples securely to prevent leaks, crushing, or exposure during transit.
- Sunlight, heat, moisture, and time can degrade sample integrity:
- For short-term transit (<24 hours): Keep samples cool and out of direct sunlight for extended time; room temperature or below is usually acceptable.
- For slightly delayed delivery (24–72 hours): Refrigerate samples using cold packs in insulated containers.
- For extended delays (>72 hours): Air-dry soil and plant tissue samples to prevent microbial changes and spoilage (oven drying is acceptable if following lab-provided temperatures). Freeze water samples.
2. Accurate and precise analysis
Analytical error in the lab can translate directly into lost yield, wasted inputs, or even regulatory noncompliance. Choosing the right laboratory is as important as choosing the right agronomic inputs. Many labs provide excellent service and are proud to demonstrate their commitment to precision and accuracy.
Selecting a laboratory—questions worth asking

- Proficiency testing: How does the lab perform in external programs like the Soil Science Society of America’s North American Proficiency Testing (NAPT) program?
- Quality assurance and quality control (QA/QC): Does the lab follow a written QA/QC protocol, such as the NAPT QA/QC guidelines?
- Transparency: Will the lab provide internal quality control charts and documentation upon request?
- Personnel qualifications: What formal education, certifications, and experience do lab technicians and managers have?
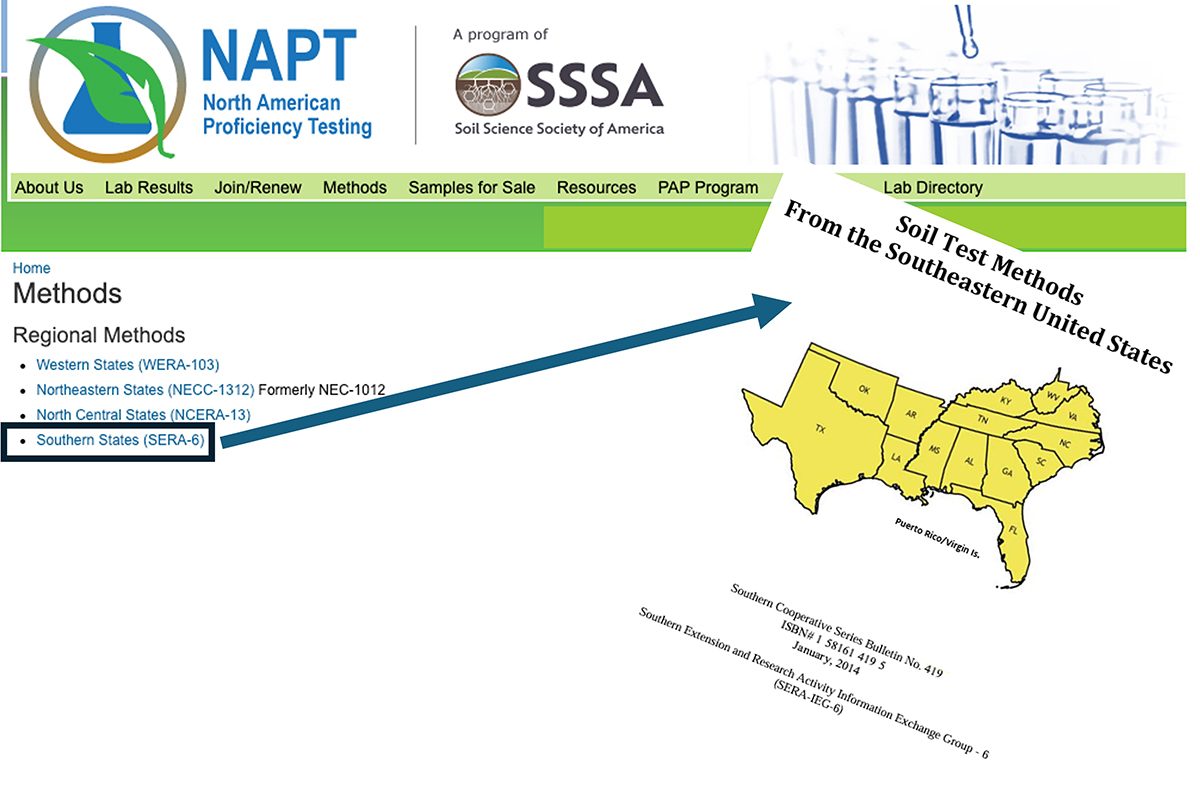
- Analytical methods: Are testing procedures taken from official method manuals and supported by peer-reviewed correlation and calibration studies for the crops and soils being evaluated?
- Facilities and equipment: Is the lab clean, well organized, and equipped with duplicate instruments to support cross-checking and to prevent downtime?
- Performance assessment: Have the specific tests needed been externally verified through programs such as NAPT’s Performance Assessment Program (PAP)? The Performance Assessment Program provides an added layer of QA/QC beyond participation in the NAPT program.
Verifying results
- Plausibility check: Do lab values generally align with visual clues, site knowledge, and expected agronomic conditions? Examples are:
- High-rainfall regions typically have lower pH, salts, carbonates, and base saturation. The opposite is true for low-rainfall areas.
- Irrigated soils should reflect irrigation water chemistry (e.g., carbonates, sodium, chloride, sulfate, nitrate, and general salts).
- Recently limed soils should show an increase in pH.
- Fields with heavy fertilizer and/or manure histories should test high in the nutrients applied (e.g., manure is especially high in phosphorus and potassium).
- Some nutrients correlate with soil texture and cation exchange capacity (CEC).
- Visual symptoms often (though not always) align with the one or more deficient nutrients found in soil and plant tissue results.
- Plant tissue nutrient concentrations should fall within expected ranges for the species and plant part as found through experience or in published averages, such as in the Plant Analysis Handbook IV by Bryson & Mills (2014).
- The cations and anions in irrigation water should balance and reflect the regional water types.
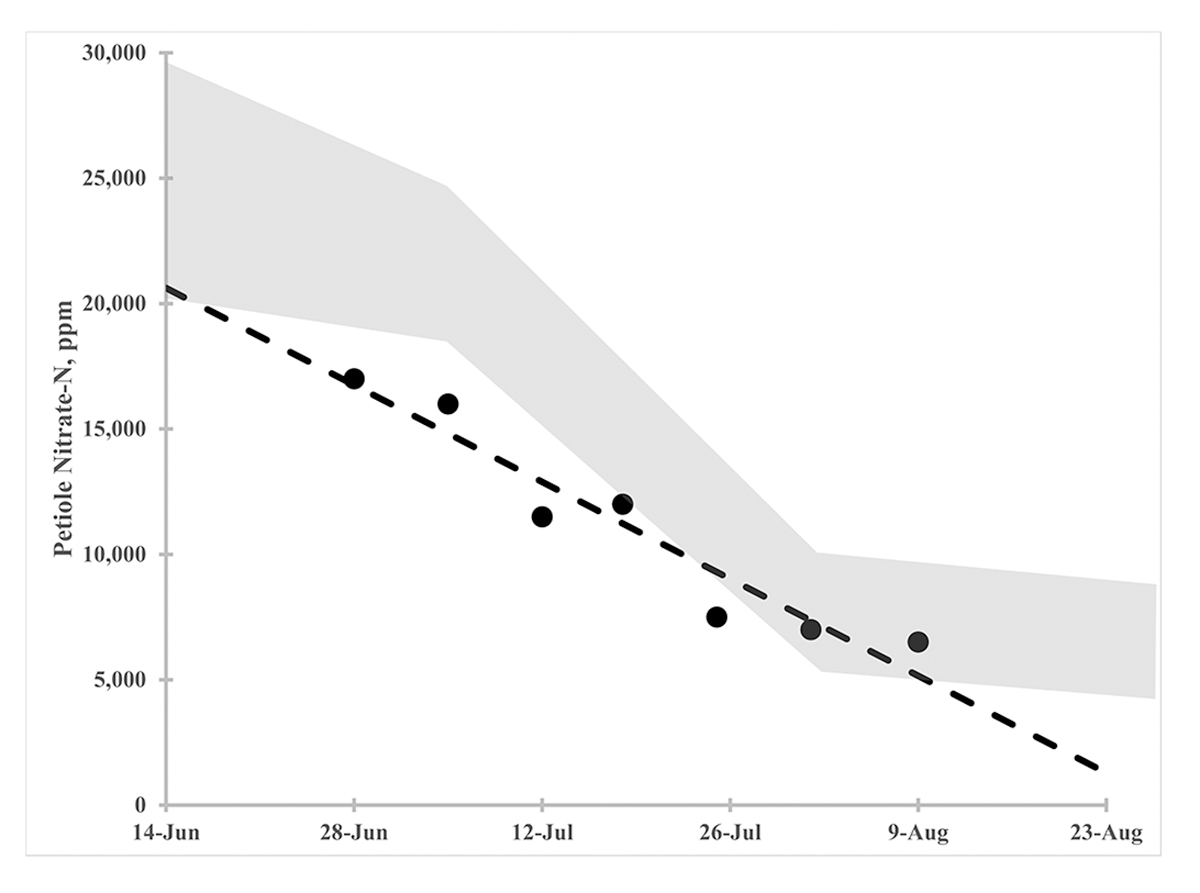
- Historical tracking: Most parameters should show general trends over time although there are notable exceptions (such as soil nitrate nitrogen). For example, a soil phosphorus doesn’t drop rapidly even with reduced inputs due to its chemistry and the vast pool of it in the soil.
- Reruns: Request reruns when results seem questionable—but avoid unwarranted and excessive retesting. Understand normal variation: e.g., a difference between 20 and 22 ppm phosphorus is acceptable, but a shift from 10 to 21 ppm may warrant attention.
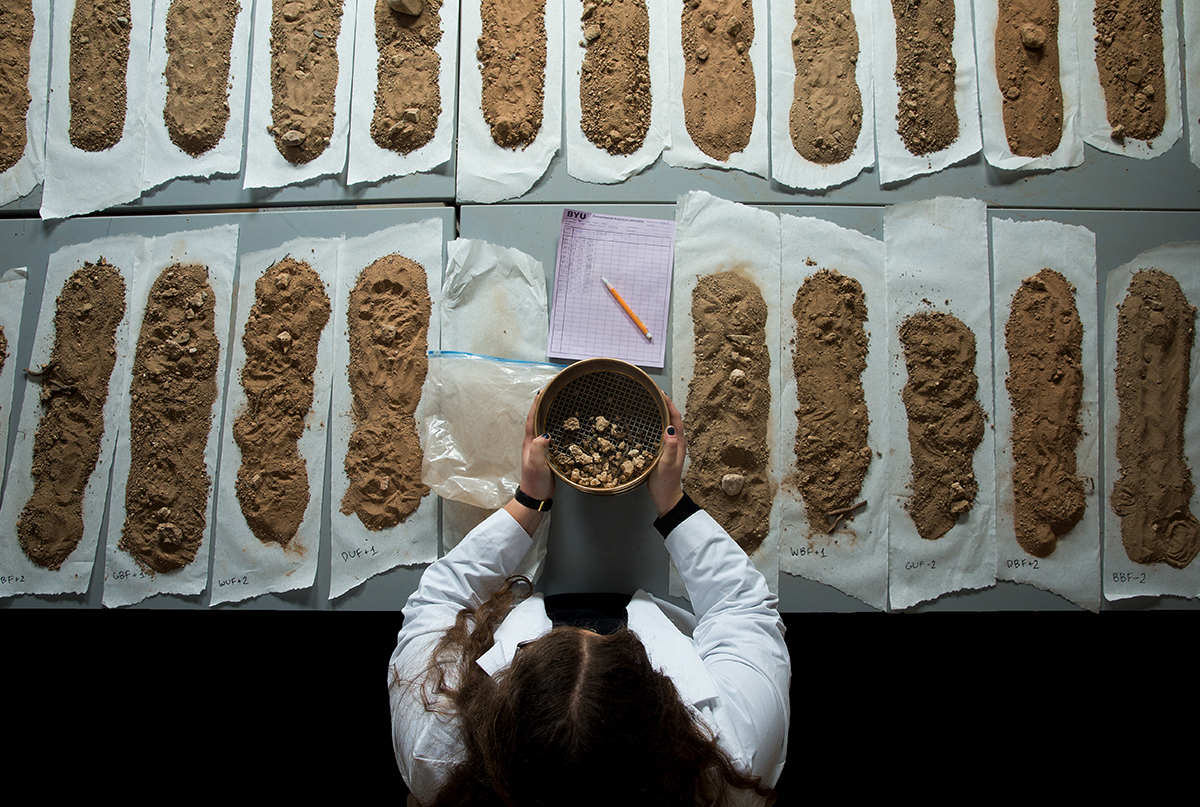
Blind and double-blind samples: Submit known-value samples with each batch or periodically to verify data quality. These can be collected and prepared by the client, but they are more conveniently and accurately available from the laboratory or from NAPT’s sample inventory. This is especially helpful (or even required) for litigation, regulatory reporting, and large projects. If creating double-blind samples, they need to be homogenized thoroughly and then calibrated against a known-value sample. The sample is “blind” if the lab knows it is a quality control sample and “double-blind” if it is not divulged.

Clients can submit double-blind, known-value samples to verify lab accuracy. In this case, a pH error was discovered as the value tested on the double-blind sample was significantly below the acceptable range of the purchased soil standard. The other values were within range.
Foster a professional relationship
- Avoid antagonism: Treat the lab as a trusted partner, not an adversary. Data quality matters to both parties—so frame questions and feedback with respect and collaboration.
- Share results: If double-blind or reference samples are submitted, consider sharing outcomes with the lab. Many labs value this feedback as part of their self-evaluation.
3. Science-based interpretation
Data only become valuable when linked to actual agronomic response. Interpretation must be grounded in research-based correlations and used appropriately for the crop, region, and management goals.
Use proven correlations—where they exist
Extensive calibration studies underpin nitrogen, phosphorus, and potassium recommendations for most major row, vegetable, and fruit crops. Lean on peer-reviewed journal articles and land grant university extension resources that translate these relationships into agronomic guidance with strong scientific backing.
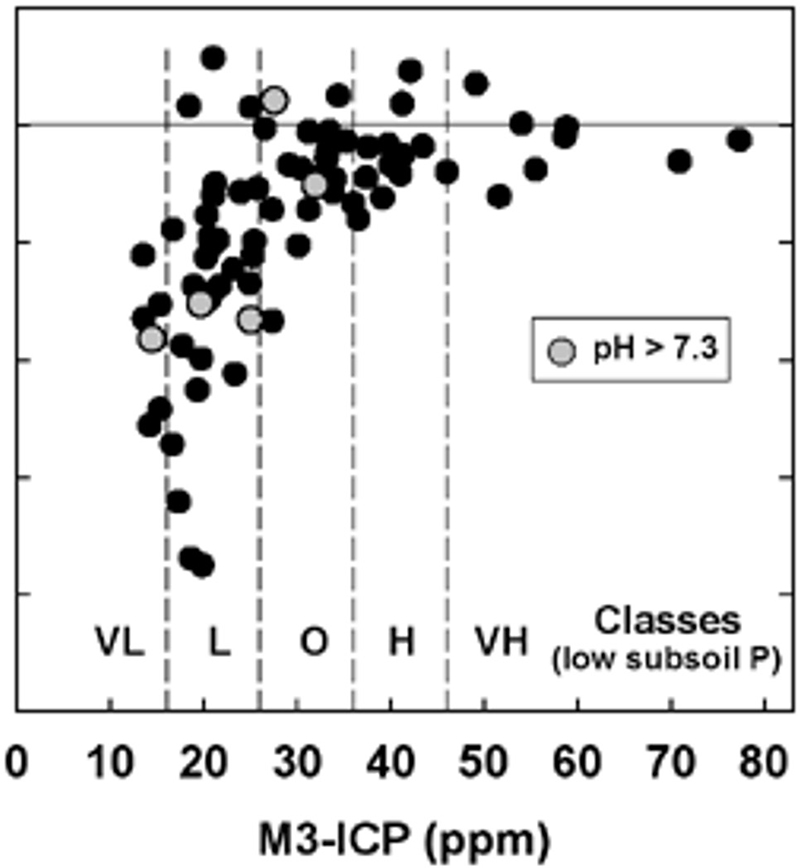
Privately developed calibration datasets can also be useful—but ensure they are transparent and scientifically sound.
A valuable recent initiative is the Fertilizer Recommendation Support Tool (FRST)—a national collaboration among public, private, and non-profit organizations. Its mission is to:
“… increase soil testing transparency by promoting clear and consistent interpretations of fertilizer recommendations by removing political and institutional (public and private) bias from soil test interpretation and providing the best possible science in order to enhance end-user adoption of nutrient management recommendations.”
FRST currently provides phosphorus and potassium recommendations for major crops with sulfur support expected soon.
Recognize weak or missing data
- Known weak tests: Some lab methods have poor or inconsistent correlations with yield or plant response. For example, soil iron extractants rarely predict actual crop response. When such tests are requested, note their limitations clearly in client communications and reports.
- Data gaps: While major crops are generally well studied, many minor crops and nutrients lack sufficient research. Furthermore, sometimes there is ample data for the major cultivars/hybrids, but information for others is lacking. For example, there is a significant amount of data available for potato (the number 1 vegetable crop in terms of value and acreage) but very little for sweet potato as it has far less of an agronomic footprint. And, within the potato data, the most commonly grown cultivar, the nutrient-inefficient Russet Burbank, has been widely studied, yet nutrient-efficient cultivars like Alturas lack a robust dataset. Decisions still need to be made in these cases, but results should be interpreted cautiously and uncertainties documented.
Avoid method misuse
Some analytical methods are inappropriate for certain situations. For instance, the Bray P1 extractant used for phosphorus is unreliable in calcareous soils common to arid and semi-arid regions. Applying methods outside their validated context can lead to false interpretations and poor recommendations.
Take-home messages
- Sample right, or nothing else matters. Control contamination and account for variability across space, depth, and time.
- Partner with a quality-focused laboratory. Look for transparent QA/QC processes, skilled personnel, proven and approved methods, strong proficiency-testing scores and performance assessment for each method used.
- Interpret results through the lens of science. Apply calibrated relationships, flag unverified or weak tests, and document uncertainties where data are lacking.
By methodically strengthening all three pillars—sampling, analysis, and interpretation—you transform raw lab numbers into sound, profitable decisions for crop production and soil management.
Self-study CEU quiz
Earn 0.5 CEUs in Soil & Water Management by taking the quiz for the article. For your convenience, the quiz is printed below. The CEU can be purchased individually, or you can access as part of your Online Classroom Subscription.
Which type of variability needs to be accounted for when taking agricultural samples?
a. Variability across space (spatial).
b. Variability by depth and height.
c. Variability over time (temporal).
d. All of the above.
2. Which three pillars form the foundation of generating reliable agricultural laboratory data?
a. Quick sampling, cost-effective testing, and fast reporting.
b. Representative sampling, accurate and precise analysis, and science-based interpretation.
c. Field scouting, fertilizer application, and yield monitoring.
d. Soil moisture testing, irrigation scheduling, and weather forecasting.
3. Which of the following is NOT a recommended criterion when selecting a laboratory?
a. Participating in proficiency testing programs like NAPT.
b. Following written QA/QC protocols.
c. Having clean facilities with duplicate instruments.
d. Ensuring internal quality control documentation and proficiency testing results are not shared with anyone.
4. What is a “double-blind” sample?
a. Lab knows it s a quality control sample.
b. Lab does not know it is a quality control sample.
c. Both the lab and the client know it is a quality control sample.
d. Both the lab and the client do not know it is a quality control sample.
5. When it comes to interpreting lab data, which of the following was NOT a recommendation made in the article?
a. Apply results across all crops, regions, and soil types.
b. Flag unverified or weak tests.
c. Document uncertainties where data are lacking.
d. Use research-based correlations.
Text © . The authors. CC BY-NC-ND 4.0. Except where otherwise noted, images are subject to copyright. Any reuse without express permission from the copyright owner is prohibited.


