Single-Strip Spatial Evaluation Approach for Easier, More Meaningful On-Farm Research

On-farm research helps farmers make more informed management decisions in their operations for increased productivity and sustainability. While conventional on-farm research designs are scientifically sound, the power to determine significant differences among various treatments is limited by the number of replications that can be put in place (more replications increase the chance to detect differences). In addition, major barriers to adoption of on-farm research have been the space (larger fields) and the time required to conduct trials during planting and harvest. As these logistical and potentially economic challenges might discourage farmers from engaging in on-farm research and be part of on-farm research networks, a new way to conduct trials was developed that makes use of yield monitor technology and advances in spatial statistics. Earn 0.5 CEUs in Crop Management by reading this article and taking the quiz.
On‐farm research helps farmers make more informed management decisions in their operations for increased productivity and sustainability (Lacoste et al., 2022). When several farmers participate in an on‐farm research network in partnership with researchers, the findings become even more relevant. Such networks forge community engagement, peer‐to‐peer knowledge exchange, and development of more extensive databases across multiple farms, regions, and time scales. This kind of collaboration has great potential to advance the development and identification of beneficial management practices and impact policy guidelines.
Conventional On‐Farm Approaches
Traditionally, on‐farm research is implemented using a randomized complete block design (RCBD) where business‐as‐usual (control) is compared against one or more management alternatives (treatments) organized in blocks that are then replicated three or more times within a field (Figure 1). Thus, if a farmer wants to compare three management approaches (three methods of application, three population densities, etc.) using three blocks (replications), there will be 3 × 3 = 9 plots to implement and harvest. Harvest can be done with truck or farm scales generating one yield value per plot.

Another research design is the split‐plot design. This design is used especially for situations where space is limited and randomization of treatment combinations is more difficult. In this method, three or more blocks of the main treatment are implemented. For instance, three strips (main plots) are created where manure is incorporated, alternating with three other strips where manure is surface‐applied as shown in Figure b. The main strips (plots) are further divided into subplots where the second treatment is applied. In the example here, the subplots have different rates of fertilizer. If we have two treatments in the main plots replicated three times, and three subplots within the main plots, this will generate 18 plots, but this design may fit narrower fields that otherwise would be an issue if the RCBD was used. With implementation of subplots, a harvester equipped with a yield monitor will make conducting the research a lot easier, but harvest can also be done with plot‐harvesting equipment or by hand.
Though both research designs are scientifically sound, the power to determine significant differences among various treatments is limited by the number of replications that can be put in place (more replications increase the chance to detect differences). In addition, major barriers to adoption of on‐farm research have been the space (larger fields) and the time required to conduct trials during planting and harvest. As these logistical and potentially economic challenges might discourage farmers from engaging in on‐farm research and be part of on‐farm research networks, we searched for a new way to conduct trials making use of yield monitor technology and advances in spatial statistics.
Yield‐Based Stability Zone Maps From Geospatial Data
Yield‐monitoring technology now allows farmers to collect yield data at one‐second intervals while the crop is harvested. These spatial data, when collected over several years, allow farmers to document yield variability within a field and across time (growing seasons). When at least three years of past yield data are collected, these data can be converted to yield‐based stability zone maps that show where yield is high or low and how variable or stable yield is across growing seasons.
While in some regions, average yield may be sufficient to derive zone maps, in the humid Northeast, average yield and yield variability over time are not correlated (Kharel et al., 2019). Under the rainfed crop production systems in New York, yield is variable and impacted by growing conditions each year. For that reason, it is essential to document both spatial and temporal variability of yield for creating zone maps.
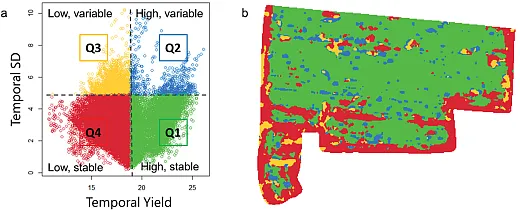
Based on evaluations of corn silage acres (847 fields, 22,447 acres) of data, an approach was developed to generate yield stability zone maps. This method takes cleaned yield monitor data (Kharel et al., 2019) from fields with at least three years of harvest records, derives interpolated maps (Cho et al., 2021b) in 6‐ by 6‐ft grids, and determines the area‐weighted average yield and the standard deviation for the farm. These two values are then used to classify whether yields in a grid cell are higher or lower than the overall farm average and stable or variable over the years (Figure 2). Each grid is then assigned a specific zone, Q1 for high and stable yield, Q2 for high and variable yield, Q3 for low and variable yield, and Q4 for low and stable yield (Figure b).
Single‐Strip Treatment Design for On‐Farm Research
While yield stability‐based zone maps can help farmers identify barriers to production, these zone maps also allow for implementation of more meaningful and easier‐to‐execute on‐farm research. With zone maps, and harvest maps for the year where a trial is implemented, a single‐strip spatial evaluation approach (SSEA) can be employed. In its most simplified form, the SSEA can be used to test a two‐treatment question (with versus without, two rates, two methods, etc.), including a wide range of topics such as the effectiveness of fertilizer, herbicide, plant density, and precision agriculture techniques. A management alternative (treatment) is implemented in a single strip along the field length (the longer the better). The treatment strip should be two to four combine or chopper widths wide and cover the zones of interest (Q1, Q2, Q3, or Q4). The rest of the field, outside of this single strip, is considered the business‐as‐usual comparison check. It is important to place the strip so that two “control strips” can be assigned, one on each side of the strip (Figure 3).

The treatment and the control strips are compared across the yield stability zone maps, and the spatial yield data are collected from the yield monitor sensor. These data provide information on the spatial and temporal variability in the field caused by the non‐uniform distribution of soil properties and other environmental factors. Accounting for variability is lost in the traditional approaches (RCBD and split‐plot) when a single yield value is collected per strip or plot. In the single‐strip approach, the yield population (yield values for each 6‐ by 6‐ft grid) in the treatment strip is compared with the yield population in the business‐as‐usual areas directly outside of the strip, and the effect of treatment is estimated using least square approach with spatial covariance for standard errors (Cho et al., 2021a).
The treatment strip can be placed in one field or multiple fields (the more the better) to evaluate whether a treatment change benefits yield in the zones of interest. Once the fields with strips have been harvested, the SSEA uses the field’s yield stability zones and the current‐season yields to evaluate the level of confidence that a certain increase in yield took place (Cho et al., 2021a). In this approach, the level of confidence of a treatment response in a given growing season is determined for each yield stability zone in the field(s) that the strip was placed in.
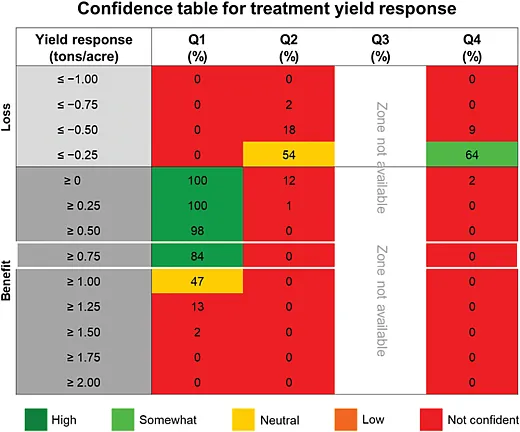
For example, treatment and control strips implemented in the field summarized in Figure 3 covered Zone Q1 (71%), followed by Q2 and Q4 (13%), and Q3 (3%). Zone Q3 was excluded from the yield analysis because of insufficient data. The confidence table for the example field (Figure 4) shows that for the year of the trial, there was a high confidence of a yield benefit of at least 0.75 tons/ac (Figure 4, highlighted) in Zone Q1 (the higher‐ and stable‐yielding areas in the field) resulting from the treatment in the single strip. The treatment did not increase yield in Zones Q2 and Q4, even suggesting a possible small decline in yield in Zone Q4. This confidence table can be done for individual fields and years, but data can also be combined across fields and years, given yield stability zones are generated for the farm, not on a per‐field basis. When confidence tables show similar results for multiple years, a farmer can gain confidence in making a management change based on the data.
A real benefit of the SSEA presented here is that it does not require a lot of space or time and can be implemented on narrower fields. When the strip is two to four harvester widths wide, a farmer does not need to slow down to align the harvester to each treatment strip either. Furthermore, this approach takes into account that fields are variable, allowing for implementation of zone‐based management that can reduce the cost of production and/or increase yield.
The example shown in Figure 3 includes the evaluation of one management change in the strip compared with business‐as‐usual in the rest of the field. The single‐strip design and spatial model can, however, also be used for comparisons of multiple treatments against the business‐as‐usual. However, when implementing multiple strips in the same field, it is essential to always leave an equal width strip of the business‐as‐usual between treatment strips.
Currently, farmers participating in the New York On‐Farm Research Partnership submit data to the Cornell Nutrient Management Spear Program to obtain the SSEA analysis and the confidence chart in the form of a farmer research report. A user‐friendly web‐based tool is under development to facilitate data submission, analyses, and reporting for on‐farm research with the SSEA and to put farmers in the driver’s seat in making informed management decisions in future years.
Looking to the Future
At present, SSEA analysis is limited to farms with yield monitor data. Not all farmers have access to yield monitor sensors and systems, and even those with the equipment have the risk of losing their data if the sensor breaks or malfunctions during harvest. Moreover, yield data cleaning is a tedious process and needs to be done carefully as the quality of the data substantially impacts the results. Other forms of geospatial data beyond the yield monitor sensor are available such as satellite and drone data. Over the last decade, satellite image resolution and drone technology adoption have opened windows to explore the possibility of conducting SSEA analysis using remote‐sensed data, and such research is currently ongoing.
Summary
The SSEA was developed in collaboration with New York farmers and stakeholders to tackle limitations to on‐farm research implementation. For farmers, SSEA is easier to implement and more informative compared with the traditional methods as it accounts for field variability. This method offers more flexibility and fewer logistical challenges. It also encourages adoption of on‐farm research among farmers and equips them to make science‐informed decisions. In addition, with more single‐strip trials added to datasets over time, farmers and researchers can gain knowledge about drivers of yield outcomes and adopt site‐specific management. When more farmers participate in on‐farm research networks, we can close the gap between research and practice while empowering farmers to take an active role in the development of sustainable and profitable agricultural approaches.
References
Cho, J.B., Guinness, J., Kharel, T., Maresma, Á., Czymmek, K.J., van Aardt, J., & Ketterings, Q.M. (2021a). Proposed Method for statistical analysis of on‐farm single strip treatment trials. Agronomy, 11, 2042. https://doi.org/10.3390/agronomy11102042
Cho, J.B., Guinness, J., Kharel, T.P., Sunoj, S., Kharel, D., Oware, E.K., van Aardt, J., & Ketterings, Q.M. (2021b). Spatial estimation methods for mapping corn silage and grain yield monitor data. Precision Agriculture, 22, 1501–1520. https://doi.org/10.1007/s11119‐021‐09793‐z
Kharel, T.P., Maresma, A., Czymmek, K.J., Oware, E.K., & Ketterings, Q.M. (2019). Combining spatial and temporal corn silage yield variability for management zone development. Agronomy Journal, 111, 2703–2711. https://doi.org/10.2134/agronj2019.02.0079
Lacoste, M., Cook, S., McNee, M., Gale, D., Ingram, J., Bellon‐Maurel, V., MacMillan, T. … & Hall, A. (2022). On‐farm experimentation to transform global agriculture. Nature Food, 3, 11–18. https://doi.org/10.1038/s43016‐021‐00424‐4
Self-Study CEU Quiz
Earn 0.5 CEUs in Crop Management by taking the quiz. For your convenience, the quiz is printed below. The CEU can be purchased individually, or you can access as part of your Online Classroom Subscription.
- What does Zone Q3 in a yield stability zone map indicate?
- Low and stable yield.
- Low and variable yield.
- High and stable yield.
- High and variable yield.
- Which of the following is required of the management alternative (treatment) in the SSEA?
- It should be two to four combine or chopper widths wide.
- It should consist of two to four strips.
- It should cover the zones of interest.
- Both a and c.
- Both b and c.
- When a single yield value is collected per strip or plot, accounting for variability is lost with the
- SSEA.
- split‐plot approach.
- RCBD approach.
- Both b and c.
- None of the above.
- The single‐strip design and spatial model can be used for comparisons of treatments against the business‐as‐usual.
- True.
- False.
- Analysis using SSEA is limited to farms with
- yield monitor data.
- wider fields.
- enough time to collect data in the summer.
- drone data.
Text © . The authors. CC BY-NC-ND 4.0. Except where otherwise noted, images are subject to copyright. Any reuse without express permission from the copyright owner is prohibited.


