Making sense of your soil report

Soil testing can help you make better farm management decisions, whether the goal is to improve crop yield, plant vigor, harvest quality, or general soil health. When you send your soil to be tested, the lab sends you back a report with valuable information.
Soil reports can be hard to interpret and translate into action without proper understanding of technical terminology and various soil parameters. This article reviews the most common soil parameters found in a soil test report and how to use that information to make informed decisions on the farm.
Earn 1 CEU in Soil & Water Management by reading this article and taking the quiz.
Getting your soil tested is the best way to get comprehensive information about its less visible properties. This information can help you make the best farm management decisions, whether you want to improve crop yield, plant vigor, harvest quality, or general soil health. When you send your soil to be tested, the lab sends you back a report with valuable information.
Soil reports can be hard to interpret and translate into action without proper understanding of technical terminology and various soil parameters. This article reviews the most common soil parameters found in a soil test report and how to use that information to make informed decisions on the farm.
Soil pH
Soil pH tells you whether your soil is acidic or alkaline. The pH scale goes from 0 to 14 with values less than 7 considered acidic, values more than 7 considered alkaline (or “basic”), and a value of 7 being neutral. The pH scale is logarithmic rather than linear: each whole number represents a 10-fold change in acidity (pH 6 is 10 times more acidic than pH 7). Generally, most soils in California are slightly to moderately alkaline.
Editor’s note: This article was originally written by University of California Cooperative Extension for California readers; thus, some information is specific to California soils. However, readers across all regions will benefit from the basic principles outlined.
Why does soil pH matter?
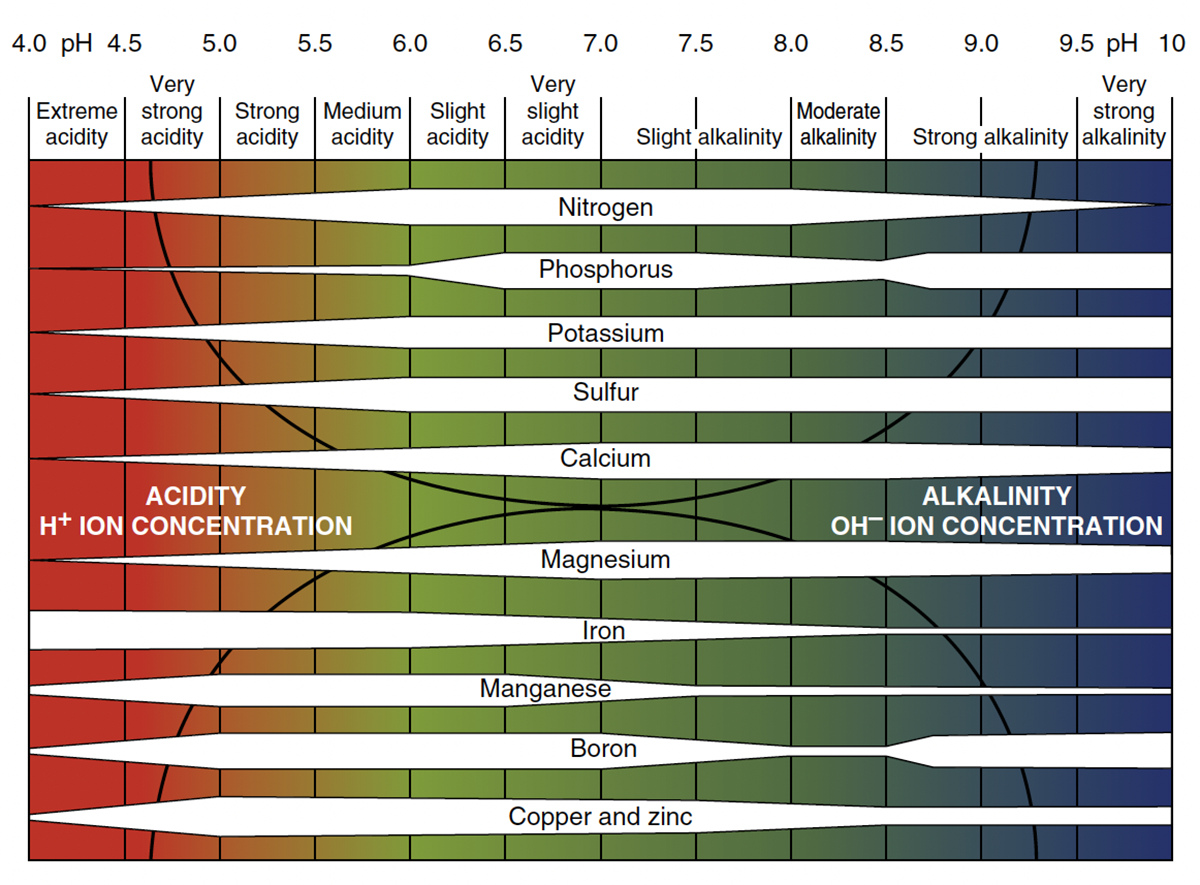
Soil pH affects nutrient availability, microbial activity, and plant growth. Most nutrients have their maximum availability between pH 6.5 and 7.5 though some nutrients vary in their availability outside this range (Figure 1). For example, phosphorus becomes less available in acidic soils (the white shaded area gets very narrow in the 4–6 range), whereas the white shaded area for iron and manganese are wider (more available) in the 4–6 range but less available in alkaline soils of pH 7.5 and above.
Practical takeaway: Managing soil pH
Maintaining the optimal soil pH range for your desired crop type is critical for improved nutrient supply and crop uptake. One way to change the pH of your soil is using amendments, which sometimes also include nutrients that crops need. If your soil pH is below 5.5, lime can be applied to raise the pH (Table 1). Dolomitic lime can be used if your soil is also low in magnesium. If your soil pH is above 8.0 and you're growing acid-loving crops like blueberries or raspberries, you can apply acidic amendments such as elemental sulfur to reduce soil pH for better establishment and growth (Table 2).
| Soil texture | Lime requirement (lb/1000 ft2) | |
|---|---|---|
| pH 4.5 to 5.5 | pH 5.5 to 6.5 | |
| Sand | 23 | 28 |
| Sandy loam | 37 | 60 |
| Loam | 55 | 78 |
| Silt loam | 69 | 92 |
| Clay loam | 87 | 106 |
| Muck | 174 | 197 |
| Present pH | Elemental sulfur (lb/100 ft2) | |
|---|---|---|
| Desired soil pH | ||
| 6.5 | 6.0 | |
| 8.0 | 3.0 | 4.0 |
| 7.5 | 2.0 | 3.5 |
| 7.0 | 1.0 | 2.0 |
Source: Western Plant Health Association (2022).
Many soils in California contain calcium carbonate (free lime), acting as a buffer against acidity development, which means the soil resists pH changes, so it may take multiple applications over several months to years to see significant change in soil pH. For most crops grown in high-pH (alkaline) soils, micronutrient deficiencies are more effectively managed through foliar applications. Always incorporate amendments into the top 6–8 inches of soil for maximum effectiveness.
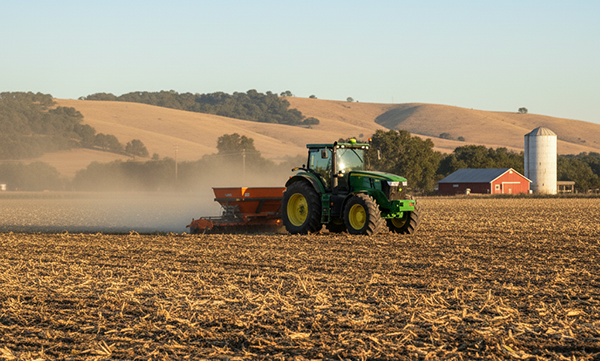
In perennial cropping systems, it can be challenging to change soil pH after planting because many amendments require thorough incorporation. Once perennial crops are established, incorporation is not feasible without risking damage to the root system. While topdressing can be used in established plantings, its effectiveness is somewhat limited. This is why it is preferable to apply and incorporate these amendments into the soil before establishing the crop.
Limestone application is not frequently observed in California since soils are generally alkaline. Sulfur is used to lower the high pH by forming sulfuric acid in soils. The quanity of sulfur required to lower the pH depends mainly on soil texture and purity of amendment.
Gypsum is another important soil amendment. While it doesn’t change the soil pH, it is used to improve soil structure, especially in soils with high sodium (sodic soils) or high magnesium (such as serpentine soils), by supplying calcium to soils.
Cation exchange capacity
Cation exchange capacity (CEC) is a measure of soil's ability to retain and exchange nutrients with positively charged ions (cations) such as calcium (Ca2+), magnesium (Mg2+), potassium (K+), ammonium (NH₄+), hydrogen (H+), and sodium (Na+). It is commonly reported using “milliequivalents per 100 grams of soil” (meq/100g), indicating the soil's capacity to hold onto nutrients.
Why does CEC matter?
Cation exchange capacity tells us whether the cations (positively charged nutrients) in our soil will be available for plant uptake for a longer time or might be lost through leaching. It also tells us about soil buffer capacity against pH; soils with a higher CEC are more resistant to change in pH. These are very important factors in decision making as you choose your crops and fertilization strategy.
Practical takeaway: Responding to your soil’s CEC
If your soil test shows low CEC (less than 6 meq/100 g), you're likely dealing with sandy soil that can't hold nutrients well (Table 3). In such conditions, consider splitting water soluble or highly mobile nutrient fertilizer applications into smaller doses throughout the season to avoid potential leaching of fertilizers. Additionally, controlled-release fertilizers could further extend nutrient availability. Building organic matter content in your soil is an effective long-term strategy for improving nutrient retention in low-CEC soils. If your soil has high CEC (more than 22 meq/100g), you can potentially make fewer, larger fertilizer applications since the soil can hold nutrients longer and is less prone to leaching.
Soil texture | Typical CEC range (meq/100 g) |
Sand and loamy sand | 2–6 |
Sandy loam | 3–8 |
Loam | 7–15 |
Silt loam | 10–18 |
Clay and clay loam | 15–30 |
Organic matter
Organic matter consists of plant and animal residues in various stages of decomposition, along with living soil organisms. Even though organic matter is a very small fraction of soil by volume, it is very important because of its influence on factors such as soil water-holding capacity, soil porosity, nutrient availability, CEC, and microbial activity. It will show up on your soil report as a percentage of the whole of your soil. In most cases, the content of organic matter positively corelates with healthier, more fertile soils.
Why does organic matter…matter?
Soil organic matter serves many important functions, contributing to soil productivity and fertility. Organic matter increases CEC, improves soil structure and water-holding capacity, serves as a source of nutrients, and feeds soil microorganisms. Breakdown of organic matter by the microorganisms is called mineralization because it releases nutrients in plant-available forms. Soil organic matter also acts as a buffer against the sudden changes in soil pH when acid- or base-forming materials are added to the soil.
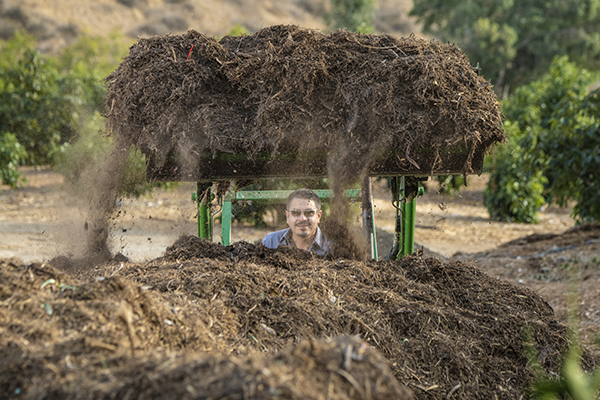
For every 1% of organic matter in the top 6 inches of a medium-textured soil (silt and loam soils), approximately 10–20 lb of nitrogen, 1–2 lb of phosphorus, and 0.4–0.8 lb of sulfur can become available per acre annually (USDA-NRCS, 2014). Similarly, each 1% unit increase in organic matter can provide us with as much as 25,000 gal of plant-available water per acre, which translates to almost an acre-inch of water.
Practical takeaway: Building soil organic matter
If your soil test results show low organic matter (less than 1%), consider adding organic amendments like compost, manure, or cover crops to build soil health. You can also incorporate residue management practices like reduced tillage to preserve existing organic matter. For low organic matter soils, expect to apply more nitrogen fertilizer in smaller, more frequent doses since these soils have limited ability to supply and retain nutrients. Remember that building organic matter is a long-term strategy—changes of even 0.5% can take years of consistent management.
Electrical conductivity
Electrical conductivity (EC) refers to the amount of dissolved salts in the soil. The dissolved salts are made up of cations (positive ions) like sodium, calcium, magnesium, and potassium and anions (negative ions) like chloride, sulfate, and bicarbonate. Electrical conductivity is measured by the conductance of electricity through these salts in soil solution and is expressed as “decisieimens per meter” (dS/m). Salts are introduced into the soil through irrigation water, fertilizers, and soil parent materials. Over time, salts can build up in the soils as crops take up water, leaving the salts behind in the root zone.
Why does soil EC matter?
Growth is negatively affected if the soil EC range is outside of a plant’s optimal requirements (Table 4). Some crops like beans, tomatoes, and most fruit are sensitive to soil salinity while others like wheat and alfalfa can relatively tolerate more salinity.
| Sensitive | Black gram, pigeon pea, rice |
| Moderately sensitive | Alfalfa, clover (ladino, red, strawberry, white), corn (forage), cowpea, meadow foxtail, orchardgrass, timothy, birdsfoot trefoil, vetch |
| Moderately tolerant | Barley (forage), smooth brome, reed canarygrass, tall fescue, meadow fescue, ryegrass, wheat, wheatgrass (intermediate, slender, western) |
| Tolerant | Bermudagrass, oats, rye, triticale, barley, tall wheatgrass |
Adapted from: Grattan (2016).
Generally, a higher salt concentration in the soil reduces the water uptake by plant roots by creating osmotic stress, decreasing optimal crop production or quality. Higher soil EC can also cause toxic levels of certain ions within plant tissues, leading to nutrient imbalances. Soil salinity is common in arid and semi-arid regions like California where high evaporation and low rainfall lead to salt accumulation in root zones.
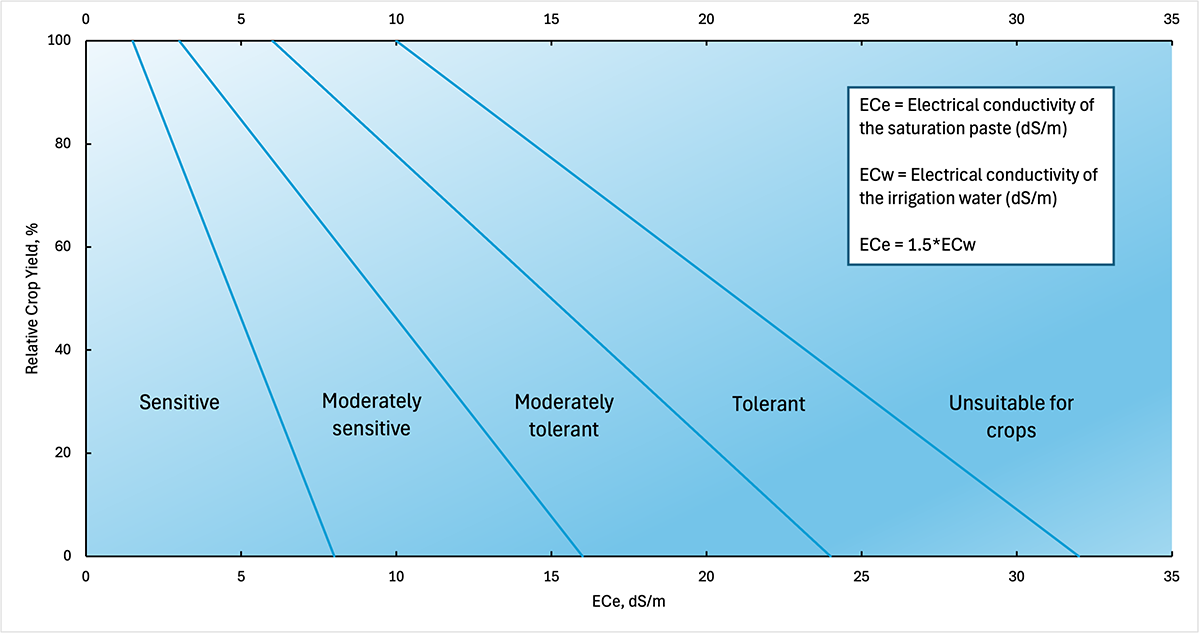
The ability of a crop to maintain yield and quality under increased salinity is described as crop salt tolerance. Crop salt tolerance is a function of yield decline under a range of salt concentrations expressed as the average root zone salinity (Figure 2). Each crop has a salinity threshold level—the maximum root zone salinity tolerated by the crop without any yield penalty. Once the root zone salinity passes this salinity threshold, crop yield declines with every unit increase in salinity, but the rate of yield decline varies by the crop species. Different crop species can be classified for their salt tolerance depending on their salinity threshold and the rate of yield decline with the exposure to increased salinity conditions following the salinity threshold (Figure 2).
Practical takeaway: Managing soil salinity
The primary strategy for combating salinity is applying good quality irrigation water to flush salts below the root zone when EC exceeds crop tolerance levels. However, effective leaching depends on the soil’s infiltration rate; if infiltration is slow due to poor soil structure or compaction, salts may accumulate in the root zone instead of being leached away. Practices like deep tillage or incorporation of organic amendments can improve infiltration by breaking the compacted layer. In fields with poor drainage or high water tables, subsurface drainage systems are often necessary to remove excess water and salts from the root zone. However, leaching during the growing season can also lead to nutrient losses, so timing and management should be carefully considered. Crops should not be water stressed when salinity stress is present, especially during drought years.
You can also switch to salt-tolerant crops appropriate for your soil salinity level and use transplants instead of direct seeding when possible (Table 4). Use the best quality water available for seedlings and consider mixing water sources if multiple options are available.
Nutrients
There are 17 essential nutrients required for plant growth and development though not all are needed in equal amounts. Depending upon your test request, the soil report will include concentration of different nutrients in your soil. The 17 essential nutrients for plant growth include carbon, hydrogen, and oxygen—which plants obtain mainly from air and water—and nitrogen, phosphorus, potassium, calcium, magnesium, sulfur, chlorine, iron, boron, manganese, zinc, copper, molybdenum, and nickel, which are primarily taken up from the soil. Among these, carbon, hydrogen, oxygen, nitrogen, phosphorus, potassium, calcium, magnesium, and sulfur are considered “macronutrients” because plants require them in larger quantities, while the rest are considered “micronutrients”, as they are needed in much smaller amounts.
Important note
A soil test is only as good as the sample submitted for analysis. Proper soil sampling is the most critical step, as field sampling errors are typically much greater than laboratory analysis errors.
Soil nutrient management varies depending on factors like soil type, crop type, growth stage, nutrient application, and nutrient mobility (how easy nutrients can move within plants and in the soil). Nutrients with high soil mobility should be applied at the right time and place for plants to take them up and to avoid runoff or other losses. Nutrients that are mobile in plants can be transported from older tissues to newer, growing tissues. Deficiency symptoms of mobile nutrients appear first in older leaves as the plant reallocates them to support new growth. However, nutrients that are immobile within plants do not move easily and are more likely to show deficiency symptoms in new growth. To maintain soil fertility, it is essential to replenish soil nutrients in a timely manner, and a soil report can be a great tool for understanding when and how to do so. Consider testing your soil every two to three years, or more frequently depending on your specific farm practices and crop needs.
Many soil reports list nutrient or fertilizer needs in parts per million (ppm). Use Table 5 to convert the units of nitrate-N soil nutrient from your soil report to per-acre units to calculate your fertilizer needs. Table 6 shows general soil parameters with their ranges for the Western U.S.
| Soil test nitrate-N | Converting nitrate-N | |
|---|---|---|
| 1 ppm | 4 lb per acre ft | 0.15 oz per 100 ft2 |
| 10 ppm | 40 lb per acre ft | 1.5 oz per 100 ft2 |
| Analyte | Units | Low | Normal | High |
|---|---|---|---|---|
| Organic matter | percent (%) | <1.0 | 1.0–3.0 | >3.0 |
| pH | pH | <6.2 | 6.2–7.8 | >7.8 |
| Soluble salts, ECe | dS/m | <0.7 | 0.7–2.0 | >2.0 |
| Free lime, CaCO3 | percent (%) | <2.0 | 2.0–3.0 | >3.0 |
| Nitrate-nitrogen (NO3–N) | ppm | <10.0 | 10.0–25.0 | >25.0 |
| Phosphorus (Olsen-P) | ppm | <12.0 | 12.0–25.0 | >25.0 |
| Potassium (K) | ppm | <100 | 100–300 | >300 |
| Calcium (Ca) | meq/L | <5 | 5–30 | >30 |
| Magnesium (Mg) | meq/L | 1–10 | Should not exceed Ca | |
| Sodium (Na) | meq/L | <3 | >5 | |
| Chloride (Cl) | meq/L ppm | <5.0 <170 | 5.0–10.0 170–350 | >10.0 >350 |
| Sulfate-sulfur (SO4–S) | ppm | <10.0 | 10.0–15.0 | >15.0 |
| Boron (B) | ppm | <0.5 | 0.5–1.2 | >1.2 |
| Iron (Fe) | ppm | <5.0 | 5.0–15.0 | >15.0 |
| Copper (Cu) | ppm | <0.5 | 0.5–1.2 | >1.2 |
| Zinc (Zn) | ppm | <0.8 | 0.8–1.5 | >1.5 |
| Molybdenum (Mo) | ppm | <0.1 | 0.1–0.2 | >0.2 |
Source: Western Plant Health Association (2022).
References
Grattan, S.R. (2016). Drought tip: Crop salt tolerance (UC ANR Publication 8562). University of California Agriculture and Natural Resources. https://anrcatalog.ucanr.edu/pdf/8562.pdf
Muhammad, S., Saa, S., Khalsa, S. D. S., Weinbaum, S. & Brown, P. (2017). Almond tree nutrition. In R. Socias i Company & T. M. Gradziel (Eds.), Almonds: Botany, production and uses (pp. 291–320). CABI.
O’geen, A. (2015). Drought tip: Reclaiming saline, sodic, and saline-sodic soils (UC ANR Publication 8519). University of California Agriculture and Natural Resources. https://anrcatalog.ucanr.edu/pdf/8519.pdf
USDA-NRCS. (2014). Soil organic matter. Soil health—Guides for educators. https://www.nrcs.usda.gov/sites/default/files/2022-10/Soil%20Organic%20Matter.pdf
Western Plant Health Association (2022). Western fertilizer handbook (10th ed.). Waveland Press.
Self-study CEU quiz
Earn 1 CEU in Soil & Water Management by taking the quiz for the article. For your convenience, the quiz is printed below. The CEU can be purchased individually, or you can access as part of your Online Classroom Subscription.
1. A soil pH of 5.0 is considered
a. acidic.
b. neutral.
c. slightly alkaline.
d. strongly alkaline.
2. What is the typical pH range where most nutrients are most available to plants?
a. 4.0–5.0.
b. 5.5–6.0.
c. 6.5–7.5.
d. 8.0–8.5.
3. Which amendment is typically used to raise soil pH?
a. Sulfur.
b. Gypsum.
c. Compost.
d. Lime.
4. Dolomitic lime should be used if the soil is low in
a. sodium.
b. magnesium.
c. iron.
d. sulfur.
- Soils in California are generally acidic, requiring frequent lime applications.
a. True.
b. False.
6. Which of the following amendments can lower soil pH?
a. Agricultural lime.
b. Elemental sulfur.
c. Gypsum.
d. Manure.
7. What is the main function of gypsum in soil management?
a. To raise pH.
b. To lower pH.
d. To improve soil structure and reduce sodicity.
d. To add organic matter.
8. Soils with low cation exchange capacity (CEC) (<6 meq/100g) are typically
a. sandy soils.
b. clay soils.
c. organic-rich soils.
d. saline soils.
9. Electrical conductivity (EC) is a measure of
a. Soil acidity.
b. Soil texture.
c. Soil compaction.
d. Dissolved salts in the soil.
10. High soil salinity primarily affects plants by
a. reducing root oxygen uptake.
b. increasing microbial decomposition.
c. limiting water uptake by roots.
d. raising soil temperature.
Text © . The authors. CC BY-NC-ND 4.0. Except where otherwise noted, images are subject to copyright. Any reuse without express permission from the copyright owner is prohibited.


