Cover crop performance in dryland wheat production systems of the Pacific Northwest
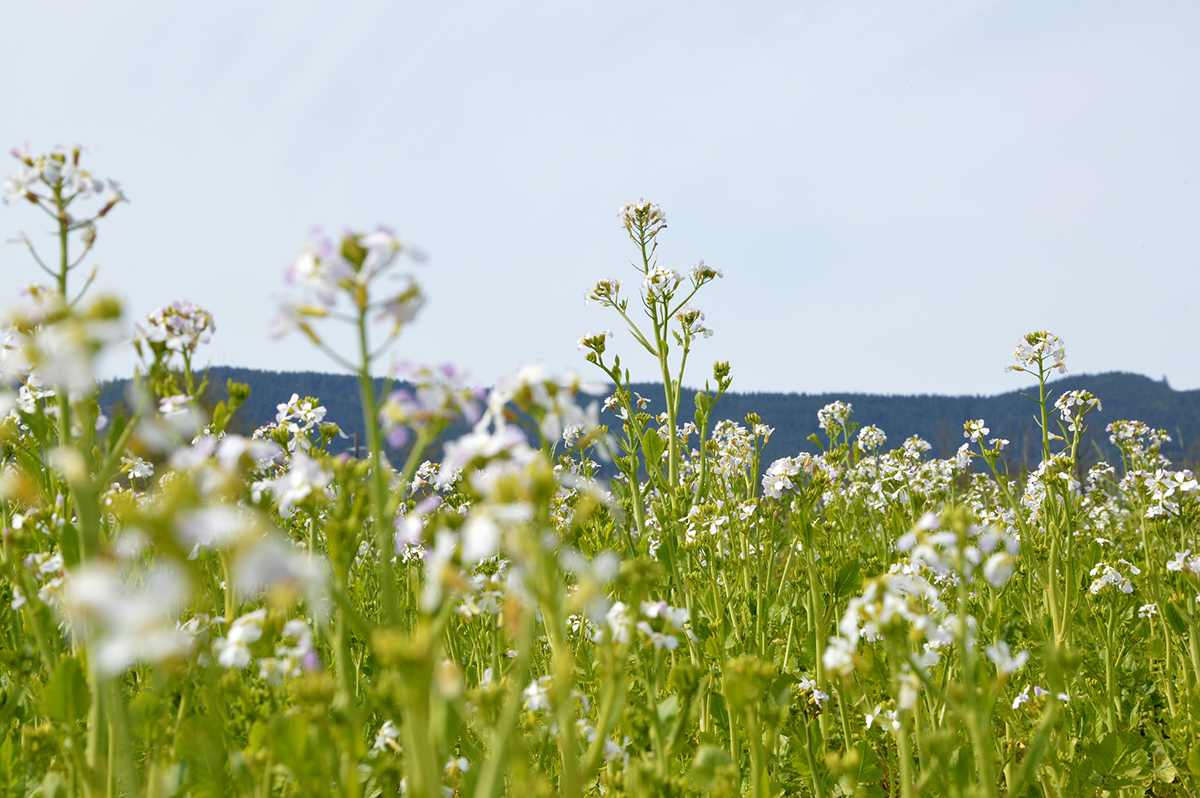

In the semi-arid areas of the dryland Pacific Northwest (PNW), cover cropping has been promoted to reduce fallow periods and improve soil quality. However, with annual precipitation less than 17 inches, the risk of water loss from the soil profile is a main barrier to adoption. This article evaluates the performance of various fall- and spring-sown cover crops in dryland winter wheat production systems across low- and intermediate-precipitation zones of the PNW.
Earn 1 CEU in Soil & Water Management by reading this article and taking the quiz.
The typical cropping system for winter wheat production in semi-arid areas—the low- and intermediate-precipitation zones—of the dryland Pacific Northwest (PNW) is a wheat–fallow rotation. The region has a mediterranean climate, characterized by cool and wet winters and hot and dry summers. With annual precipitation of 16.5 inches or less, soil moisture is the greatest factor limiting yield and farm profitability in this environment. As such, fallow is practiced in which the land remains unplanted to conserve water for the following crop.
Cover cropping has been promoted to reduce fallow periods and improve soil quality. Depending on the environment and system management, benefits of cover cropping can include reduced soil erosion, increased soil nutrient retention, soil shading, stabilization or enhancement of soil organic matter, improved soil water infiltration, increased system biodiversity, and weed, pest, and disease suppression. However, the risk of water loss from the soil profile is a main barrier to adoption of cover cropping, especially in water-limited, low-input production systems.
Cover cropping has been well studied in some regions, but there is very limited information available to wheat growers in the semi-arid PNW and similar mediterranean climate regions. This study was conducted to identify some of the risks and benefits of cover cropping in these areas, with specific objectives to evaluate cover crops growth, effects on soil water, and potential for weed control.
Methodology
The experiment was conducted in crop years 2021 and 2022 at two sites in the low- and intermediate-precipitation zones of the dryland PNW of eastern Oregon. Thus, the experiment had four total site-years. The low-precipitation site was near Lexington, OR, and the intermediate-precipitation site was near Adams, OR. Each year differed from the normal precipitation patterns with 2021 being drier than average and 2022 having a historically wet spring.
The experiment was a test of nine cover crops, including both fall- and spring-sown species. Fall-sown cover crops were winter pea, winter lentil, and a three-species mix (winter barley, Austrian peas, and yellow mustard). Spring-sown cover crops were common vetch, yellow mustard, lacy phacelia, tillage radish, spring barley, and a six-species mix (spring barley, Austrian peas, yellow mustard, lacy phacelia, tillage radish, and common vetch). The seeding dates for the fall-sown cover crops were in October while the spring-sown cover crops were seeded in March. The cover crops were planted into weed-free (herbicide treated) conditions but were not given any in-season inputs such as fertilizer or weed control.
The cover crops were chemically terminated from mid-to-late May, a timing chosen to balance biomass production with the insurance status of the crop (i.e., allowing cover crops to grow past June 1 changes their status from cover crop to cash crop under insurance guidelines). The data collected included cover crop and weed biomass at the time of cover crop termination and soil moisture following termination (just in 2022) to coincide with the timing of subsequent wheat cash crop planting. Further information is available in Barroso et al. (2025), Singh et al. (2021), and Singh et al. (2022).
Results
Cover crop and weed biomass
Fall-sown cover crop species generally produced more biomass than the spring-sown species, which overall did not perform well. The fall mix and winter pea produced statistically similar amounts of biomass, excluding one site-year in which winter pea biomass exceeded that of the fall mix (Table 1). Although fall mix and winter pea generally produced significantly more biomass than spring-sown cover crops, fall-sown winter lentil often did not vary substantially from most spring-sown species (Figure 1). Yellow mustard was among the bottom three cover crops for biomass production across both years and locations, and performance of other spring-sown cover crops was variable by location and year.
Cover crop dry biomass (lb/ac) | ||||
|---|---|---|---|---|
Adams | Lexington | |||
| Cover crop | 2021 | 2022 | 2021 | 2022 |
| Fall-sown species | ||||
| Winter lentil | 213 cd | 535 bc | 29 cd | 639 b |
| Winter pea | 847 ab | 787 b | 143 abc | 4895 a |
| Fall mixa | 1218 a | 1678 a | 888 a | 3937 a |
| Spring-sown species | ||||
| Spring barley | 434 bc | 339 bc | 229 ab | 455 b |
| Yellow mustard | 97 d | 567 bc | 5 de | 71 b |
| Lacy phacelia | 150 d | 387 bc | 5 de | 170 c |
| Common vetch | 89 d | 388 bc | 23 cde | 460 b |
| Tillage radish | 245 cd | 453 bc | 4 e | 237 b |
| Spring mixa | 182 cd | 300 c | 87 bc | 350 b |
Note: This table was adapted from Barroso et al. (2025).
aThe fall mix included winter barley, winter pea, and yellow mustard. The spring mix included spring barley, Austrian peas, yellow mustard, lacy phacelia, tillage radish, and common vetch.
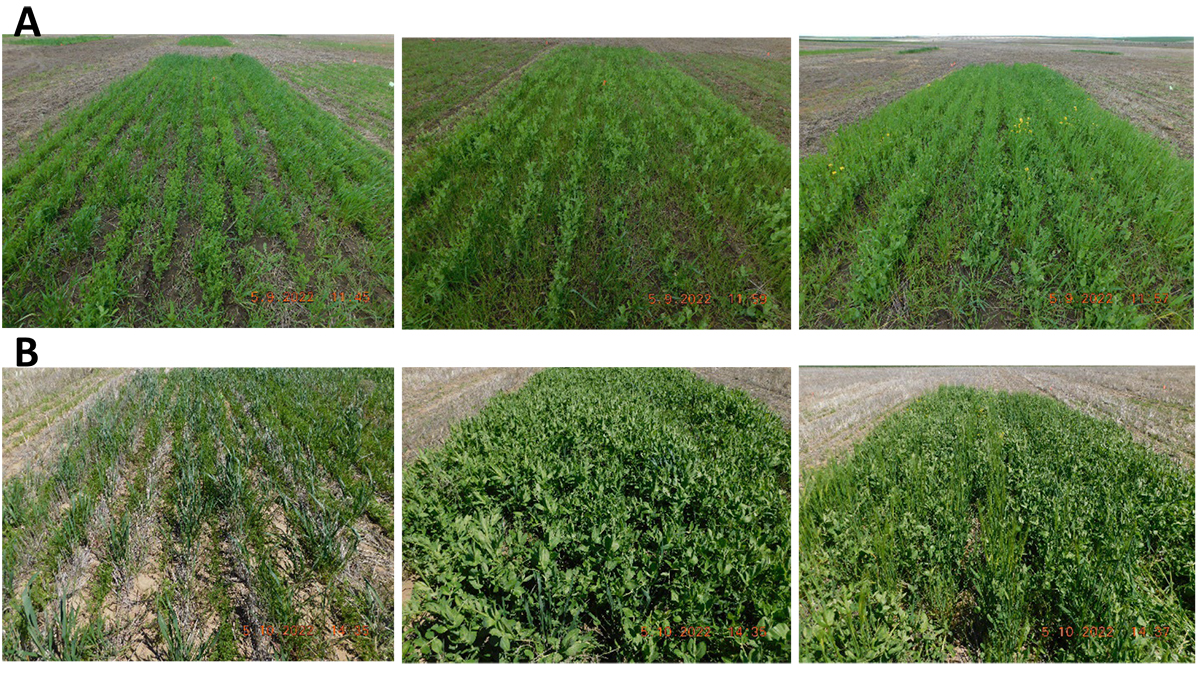
The most common weed species that infested the cover crops at both sites were downy brome, volunteer wheat, and prickly lettuce. At Adams, the predominant weed species in fall- and spring-sown cover crops for both years was downy brome. In contrast, the predominant weed species at Lexington varied by cover crop seeding time. Volunteer wheat was the most prevalent weed in fall-sown cover crops, and downy brome was the predominant in spring-sown systems. Although the three most abundant weeds in the study were annual species that germinate foremost in the fall, the high presence of downy brome and prickly lettuce in spring-sown cover crops indicate the poor competition exerted by these crops and that these two weed species can have significant germination in spring as well.
In the drier 2021 season, the weed biomass was generally greater than the cover crop biomass. However, in the wetter 2022 year, cover crop production was greater and weeds were better suppressed (Tables 1 and 2). Weed infestation was typically greater in the fall-sown cover crop systems, particularly lentils, than in spring-sown cover crop systems. This difference is primarily related to the predominant weed species in the area that have a majority of their germination period in fall and winter in addition to the later weed control that happened before the seeding of the spring-sown cover crops. Weed biomass was similar in the fall mix and winter peas, indicating a similar competitive ability of these cover crops (Table 2). Weed biomass was generally similar among all spring-sown cover crop species (Table 2).
Weed biomass (lb/ac) | ||||
|---|---|---|---|---|
Adams | Lexington | |||
| Cover crop | 2021 | 2022 | 2021 | 2022 |
| Winter lentil | 2449 a | 692 a | 1208 a | 411 a |
| Winter pea | 2260 a | 800 a | 1107 ab | 264 ab |
| Fall mixa | 1792 a | 276 ab | 596 ab | 173 ab |
| Spring barley | 199 c | 226 ab | 354 b | 37 ab |
| Yellow mustard | 383 b | 210 ab | 381 b | 46 ab |
| Lacy phacelia | 257 bc | 284 ab | 402 b | 42 ab |
| Common vetch | 408 b | 345 ab | 423 b | 70 b |
| Tillage radish | 495 b | 268 ab | 437 ab | 30 b |
| Spring mixa | 601 b | 344 ab | 636 ab | 68 b |
| Fallow | ND | 45 b | NDb | 4.7 c |
Note: This table was adapted from Barroso et al. (2025).
aThe fall mix included winter barley, winter pea, and yellow mustard. The spring mix included spring barley, Austrian peas, yellow mustard, lacy phacelia, tillage radish, and common vetch.
bND, not determined.
Soil moisture
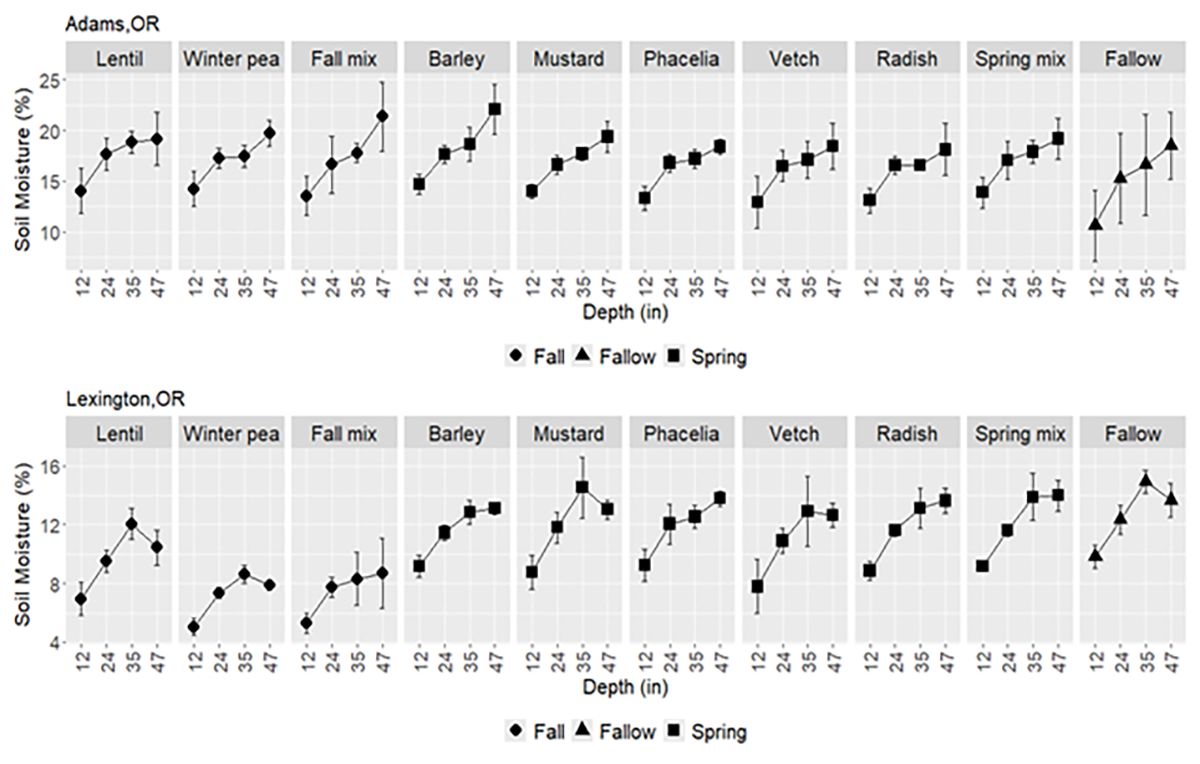
At the intermediate-precipitation Adams site, no differences in gravimetric soil water content were observed among individual cover crops although, collectively, there was greater mean soil water content following cover crops compared with fallow (Figure 2). It is important to note that the soil moisture was measured after an unusually wet spring and several months after cover crop termination to coincide with wheat planting. At the low-precipitation Lexington site, the soil water content following fall-sown cover crops was significantly lower than spring-sown cover crops and fallow (Figure 2). Soil moisture depletion was associated to biomass production.
Discussion
Across sites and years, fall-sown cover crops performed best with winter pea and fall mix being the top two biomass-producing treatments. Biomass production was very limited for spring-sown cover crops. In this mediterranean climate, seeding in the fall has the advantage of a longer growing period with more favorable moisture conditions (i.e., most precipitation occurs during winter and early spring).
The potential benefits of cover crops to the soil in this environment depend on the amount of biomass produced. In a broad analysis of cover crops in temperate regions, Hughes et al. (2023) estimated that a minimum threshold of about 1,150 lb/ac of cover crop biomass is needed for soil carbon stocks to increase. Others have reported that cover crop biomass must reach approximately 7,100 lb/ac to effectively suppress weeds though lower levels can also be effective but with greater variability (Fernando & Shrestha, 2023; Silva & Bagavathiannan, 2023).
In the current study, no spring-sown cover crops met the biomass thresholds given in these studies while the best-performing fall-sown cover crops sometimes did (Table 1). Thus, the key benefits that can come from cover crops would be expected only with the most vigorous fall-sown species similar to the winter pea and fall-sown mix included in this study.
One potential benefit of cover crops can be a reduction in the frequency of herbicide use to control weeds. The spring-sown cover crops did not save any herbicide application as they received the same herbicide applications as the fallow plots with no observed reduction in weed infestation. However, the fall-sown cover crops saved one herbicide application compared with fallow.
Even though weeds were present in the fall-sown cover crop systems, timely chemical termination of the cover crop in mid-May prevents production of viable weed seed, reducing the potential for future weed infestations. For downy brome in fall-sown cover crops, termination day should occur before 1000 growing degree-day accumulation to prevent downy brome from developing viable seeds (Ball et al., 2004), which for the semi-arid region of PNW, normally happens somewhere between mid- and late May.
Consumption of soil water by cover crops is a primary concern in dryland cropping systems though cover crops can also have a positive effect in soil water by enhancing the rate of water infiltration and reducing the rate of surface evaporation (Dabney, 1998). The dryland wheat production region of the PNW ranges widely in average annual precipitation from about 6.0 to 24 inches per year, and thus the effect of cover crops on soil moisture would be expected to differ across the region, just as observed in this study. The similarity in soil moisture following fall-sown cover crops and fallow at the intermediate-precipitation site suggests that any treatment-based differences in soil moisture loss (or consumption) were counteracted by positive factors (e.g., increased infiltration and/or reduced evaporation). It is again important to note that precipitation in 2022 not only exceeded the annual average, but also that a significant part of that precipitation occurred around the time of cover crop termination during April and May (Figure 2). Even in average-precipitation years, intermediate-precipitation sites like Adams have greater potential for soil water to recharge following cover crop termination than drier sites like Lexington.
Overall, fall-sown cover crops, especially winter peas and the three-species fall mixture, showed the most promise with some caveats. The elimination of one herbicide application is a desirable consequence of growing cover crops, not only for a reduction in input costs, but also for reducing the frequency of herbicide applications to help slow down the development of herbicide-resistant weeds. Cover cropping was most favorable at the intermediate-precipitation site where fall-sown cover crops have the potential to more consistently reduce weed infestation and herbicide pressure and have other beneficial effects without compromising subsequent cash crop yields. However, more research is needed to fully understand the effects of cover crops on soil water in the region, particularly with the high year-to-year variability in precipitation experienced during this study. Research on the effects of cover crops on the following winter wheat cash crop are also needed to determine the profitability of cover cropping in the region.
Acknowledgments
The authors thank Rebecca McGee for recommendations on legume cultivars and for providing the winter peas, the OSU and USDA farm managers (Kyle Harrison, Steve Umbarger, Kyle Carson, and Bret Carter) for conducting the farming in the experiments, and the Starvation Farm (Chris and Andre Rauch) for hosting the Lexington site for this study.
This material is based upon work supported by the USDA-ARS under Agreement No. 58-2074-9-002, as part of the Resilience Dryland Farming Alliance (RDFA).
Ball, D. A., Frost, S. M., & Gitelman, A. I. (2004). Predicting timing of downy brome (Bromus tectorum) seed production using growing degree days. Weed Science, 52, 518–524. https://doi.org/10.1614/WS-03-067
Barroso, J., Reardon, C. L., Singh, S., Machado, S., Gourlie, J. A., Furhman, C. E., & Smith, R. D. (2025). Biomass production, weed suppression, and soil water use of cover crops in dryland wheat production systems. Agronomy Journal, 117, e70053. https://doi.org/10.1002/agj2.70053
Dabney, S. M. (1998). Cover crop impacts on watershed hydrology. Journal of Soil and Water Conservation, 53, 207–213.
Fernando, M., & Shrestha, A. (2023). The potential of cover crops for weed management: A sole tool or component of an integrated weed‐management system? Plants, 12(4), 752. https://doi.org/10.3390/plants12040752
Silva, C. G., & Bagavathiannan, M. (2023). Mechanisms of weed suppression by cereal rye cover crop: A review. Agronomy Journal, 115(4), 1571–1585. https://doi.org/10.1002/agj2.21347
Singh, S., Adams, C., Barroso, J., Calderón, F. J., Gourlie, J. A., Graebner, R. C., Harris, R. S., & Jones, T. E. (2022). Resilient Dryland Farming Alliance 2021–2022 annual report: Cover crop trial. Oregon State University. https://extension.oregonstate.edu/sites/default/files/documents/12596/rdfa-cover-crop-report-2022-final.pdf
Singh, S., Barroso, J., Calderón, F. J., Gourlie, J. A., Graebner, R. C., Harris, R. S., & Jones, T. E. (2021). Resilient Dryland Farming Appropriation (RDFA) 2020–2021 annual report: Cover crop trial. Oregon State University Extension Service. https://extension.oregonstate.edu/educational-document/resilient-dryland-farming-appropriation-rdfa-2020-2021-annual-report-cover
Self-study CEU quiz
Earn 1 CEU in Soil & Water Management by taking the quiz for the article. For your convenience, the quiz is printed below. The CEU can be purchased individually, or you can access as part of your Online Classroom Subscription.
- The dominant cropping system for winter wheat in the semi-arid Pacific Northwest is
a. wheat–corn rotation.
b. wheat–fallow rotation.
c. wheat–soybean rotation.
d. wheat–canola rotation.
- The main factor limiting wheat yield and profitability in the study area is
a. soil fertility.
b. temperature.
c. soil moisture.
d. pest pressure.
- Which of the following crops was NOT included in any of the cover crop mixes?
a. Crimson clover.
b. Yellow mustard.
c. Austrian peas.
d. Winter barley.
- Cover crops were chemically terminated around
a. late March.
b. early April.
c. mid- to late May.
d. early June.
- Spring-sown cover crops generally produced more biomass than fall-sown cover crops in this study.
a. True.
b. False.
- The most common weed species observed in the study included
a. wild oat, quackgrass, and kochia.
b. Canada thistle, Russian thistle, and foxtail.
c. pigweed, lambsquarters, and cheatgrass.
d. downy brome, volunteer wheat, and prickly lettuce.
- At the Lexington site, soil water content following fall-sown cover crops was
a. lower than in spring-sown crops and fallow.
b. higher than in spring-sown crops.
c. Equal to that in fallow plots.
d. Not measured.
- A minimum of about how much cover crop biomass is needed to increase soil carbon stocks, according to Hughes et al. (2023)?
a. 500 lb/ac.
b. 1,150 lb/ac.
c. 3,000 lb/ac.
d. 7,100 lb/ac.
- To effectively suppress weeds, other studies suggest that cover crop biomass should reach approximately
a. 2,800 lb/ac.
b. 4,200 lb/ac.
c. 5,300 lb/ac.
d. 7,100 lb/ac.
- Overall, the study concluded that cover cropping was most favorable at
a. The low-precipitation site.
b. The high-precipitation site.
b. The intermediate-precipitation site.
d. None of the above.
Text © . The authors. CC BY-NC-ND 4.0. Except where otherwise noted, images are subject to copyright. Any reuse without express permission from the copyright owner is prohibited.


