Soil-Sampling Grid Size Considerations for Site-Specific Nutrient Management in Southeastern U.S.


One of the most important aspects of site-specific nutrient management is precision soil sampling such as grid- and zone-based strategies to determine varying soil nutrient levels within a field. And for grid soil sampling, one of the most important considerations is the size of the grids as it affects both the sampling resolution and costs. Questions and concerns from growers about the effectiveness of different grid sizes in accurately depicting soil nutrient variability have become common recently, warranting an investigation into how grid size affects application accuracy and economics of site-specific nutrient management in the southeastern U.S. Earn 0.5 CEUs in Nutrient Management by reading this article and taking the quiz at https://web.sciencesocieties.org/Learning-Center/Courses.
Highly inherent spatial variability within agricultural fields is common and a major challenge to row crop production, especially in the southeastern United States. This spatial variability can be attributed to many factors, including topographical features, soil properties, and historical field management, and is primarily addressed through site-specific crop management. Among different site-specific management strategies used by growers, variable- rate fertilizer applications to address within-field nutrient spatial variability is one of the widely adopted practices in precision agriculture (Lowenberg‐DeBoer & Erickson, 2019).
One of the most important aspects of site-specific nutrient management is precision soil sampling such as grid- and zone-based strategies to determine varying soil nutrient levels within a field. In grid sampling, a field is divided into uniform-sized grids, and a composite soil sample (representative of the whole grid) is taken from each grid (Flowers et al., 2005). Soil sampling based on management zones consists of utilizing various soil and crop features, remotely sensed information, farmer knowledge, and/or other spatial data (Hornung et al., 2006) to delineate homogenous areas within the field and collect a sample from each zone. While both grid and zone sampling are effective precision soil-sampling methods, grid sampling remains one of the most widely used approaches by consultants and growers in the southeastern U.S. (Walton et al., 2010), primarily due to its ease of implementation and that it requires no previous knowledge of field history or any other data.
One of the most important considerations in grid soil sampling is the size of the grids as it affects both the sampling resolution and costs. Generally, smaller grid sizes are recommended to capture the most spatial nutrient variability within the fields; however, a smaller grid size also means more soil samples and greater costs. Therefore, larger grid sizes of ≥5 ac have become more common among consultants and growers in the southeastern U.S. over the years to reduce soil sampling and analysis costs. Contrarily, with rising input costs (especially fertilizer) and shrinking profit margins in recent years, most growers are also interested in making more informed, data-driven decisions to improve input use efficiency and productivity in their farming operations. Consequently, questions and concerns from growers about the effectiveness of different grid sizes in accurately depicting soil nutrient variability have become common recently, warranting an investigation into how grid size affects application accuracy and economics of site-specific nutrient management in the southeastern U.S.
Soil Sampling Using Different Grid Sizes
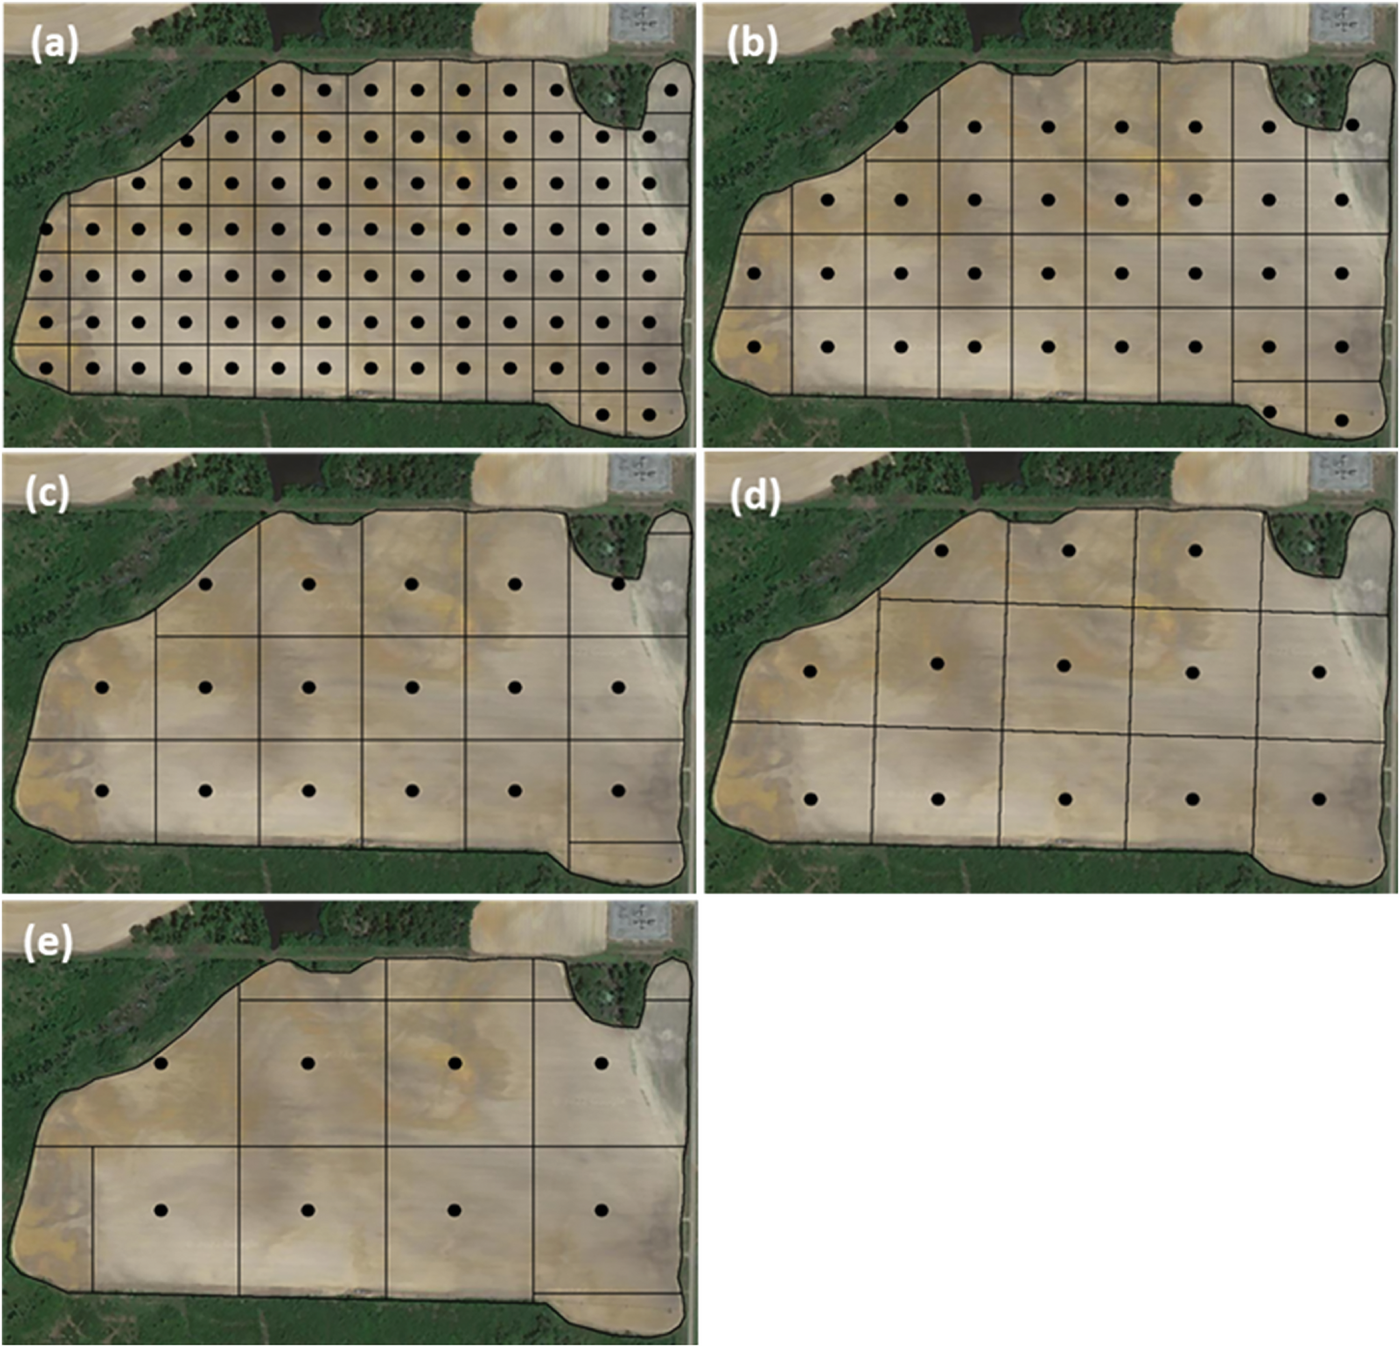
Researchers at the University of Georgia conducted precision soil sampling using five different grid sizes of 1.0, 2.5, 5.0, 7.5, and 10.0 ac in nine fields ranging from 20 to 93 ac in the physiographic region of the southeastern U.S. in 2022. To obtain a reference of (assumed) actual spatial nutrient variability within each field, a high-density soil sampling (approximately two to three samples per acre) was also conducted. Soil-sampling maps for different grid sizes were created using SMS Advanced software (AgLeader Technology, Ames, IA) and are shown in Figure 1 for one of the fields used in this study. All soil samples were analyzed at the University of Georgia Agricultural and Environmental Services Laboratories located in Athens, GA. From soil test results, spatial maps for soil pH, P, and K along with the corresponding variable-rate prescription (Rx) maps based on each grid size were created for all fields. Similarly, spatial nutrient and variable-rate Rx maps (soil pH, P, and K) from soil test results for the high-density soil sampling were also created for each field. Since cotton is one of the predominant row crops in the southeastern U.S., the fertilizer recommendations in all Rx maps were based on a cotton yield goal of 1200 lb/ac. To determine the application accuracy associated with each grid size, the Rx maps were spatially analyzed and compared to the reference Rx map to determine the amount of under- and over-application in each field.
To assess how grid size influences total application costs ($/ac), an economic analysis was performed using the amount of lime and fertilizer recommended by each grid size along with the current lime and fertilizer prices (lime = $50/ton, P = $0.67/lb, and K = $0.68/lb; accessed from the 2022 University of Georgia Row Crop Budgets). For this analysis, a fixed soil sampling cost of $4/ac and a soil analysis fee of $6 per sample (based on the commonly charged fees by consultants and laboratories, respectively, in the southeastern U.S.) were used. The total application cost ($/ac) included the soil-sampling cost ($/ac), the sample analysis cost ($/ac), and the material cost ($/ac) for lime, P, and K.
Application Accuracy of Different Grid Sizes
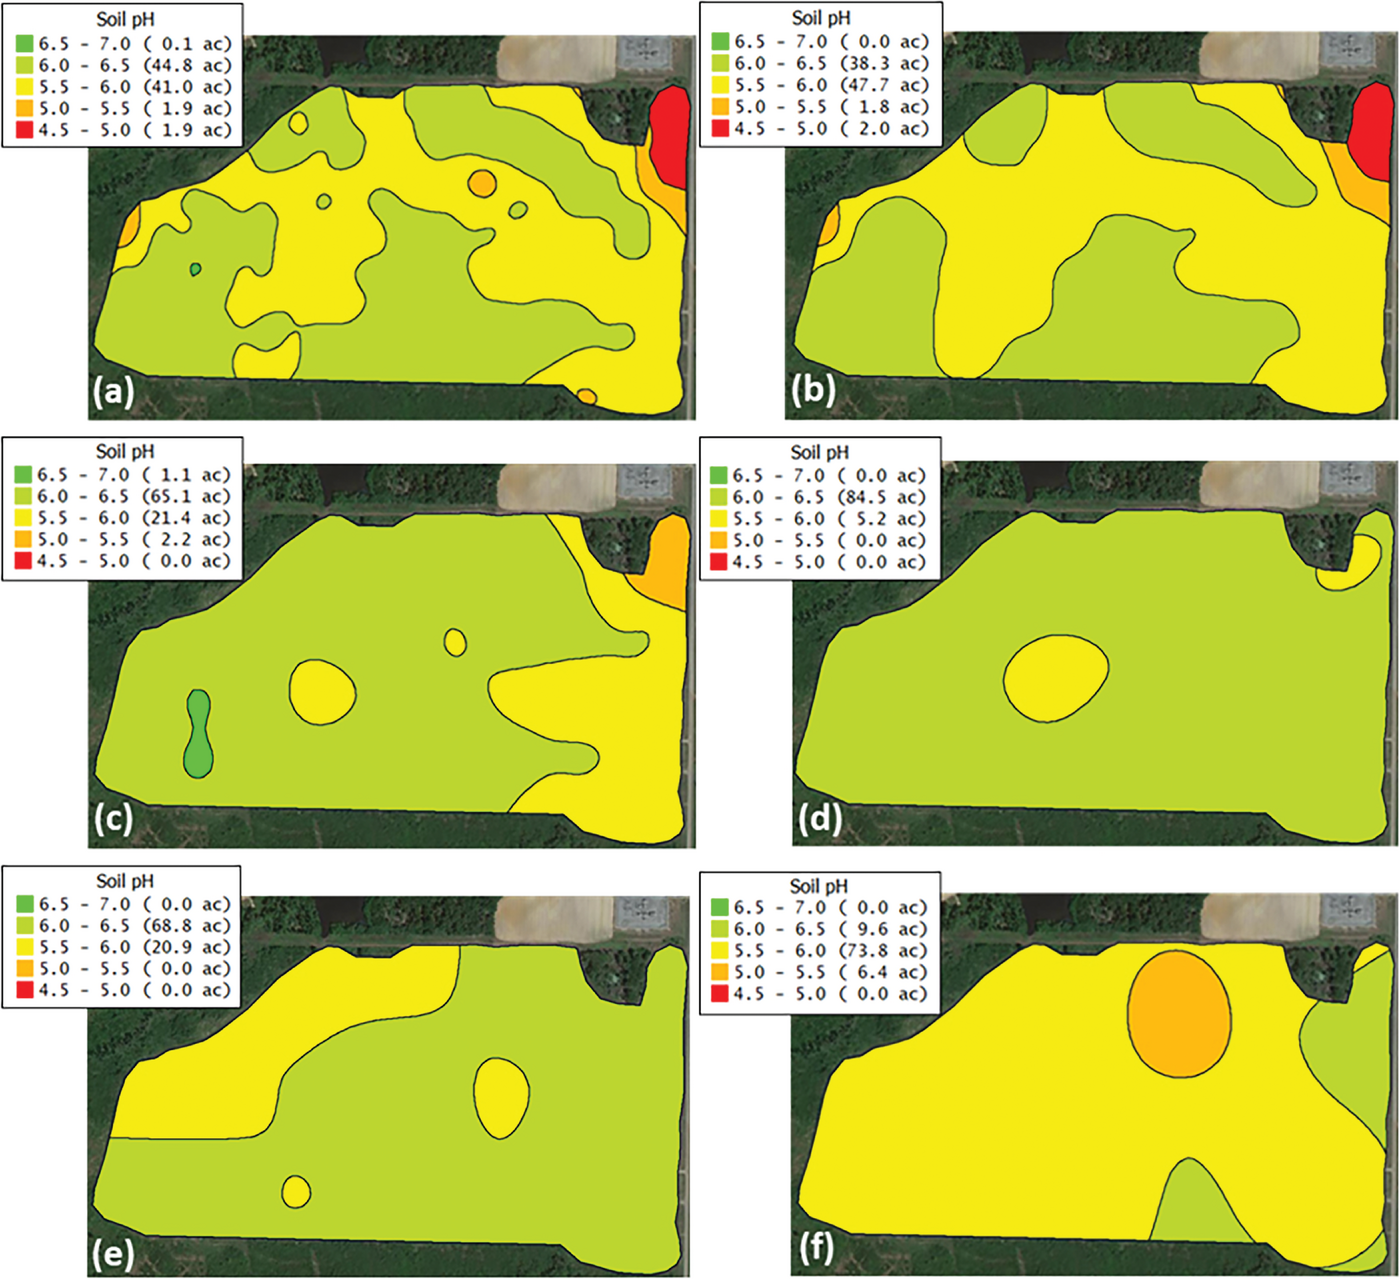
Figure 2 presents the soil pH maps for one of the fields used in this study to illustrate visual differences in depiction of spatial nutrient variability among different grid sizes. The soil pH map based on the 1-ac grid size (Figure 2b) is closely associated with the reference map (Figure 2a). Similarly, the soil pH map based on the 2.5-ac grid sampling (Figure 2c) shows some resemblance with the reference map; however, this correlation diminishes rapidly as the grid size increases from 5.0 to 10.0 ac (Figure 2 d-f). The exact differences in these maps can further be discerned by observing the respective areas under each soil pH range (Figure 2) and comparing it to the area for the same range in the reference map (Figure 2a). This effect of grid size on depiction of spatial nutrient variability translates directly to the variable-rate Rx maps; therefore, similar results were noticed for lime, P, and K in all fields when assessing application accuracy associated with different grid sizes.
The application accuracy (%) for lime, P, and K along with material cost ($/ac) (averaged across all sites) associated with different grid sizes are presented in Table 1. Compared with the reference map, the application accuracy represents the percent area within each field that would receive the correct nutrient rate at the correct place based on soil sampling using a certain grid size. These data showed a similar trend as observed from the maps in Figure 2 where the application accuracy was consistently greater (>80%) for the grid size of 1.0 ac followed by the 2.5-ac grid size (60–76%) and then reduced considerably (≤73%) thereafter with an increase in soil sampling grid size from 5.0 to 10.0 ac. When observing these results among all the fields used in this study, the application accuracy was found to be ≥80% for all three nutrients (i.e. lime, P, and K) in at least eight out of all nine fields for the grid size of 1.0 ac. For the 2.5-ac grid size, it was ≥80% for all three nutrients (i.e. lime, P, and K) for only one field, which suggested that it may be appropriate to use this grid size in some fields. For grid sizes of 5.0 ac or larger, an application accuracy ≥80% for all three nutrients combined was not observed in any of the fields, indicating the ineffectiveness of larger grid sizes in accurately representing spatial nutrient variability in most fields. It is worth mentioning that 5.0 ac is the most commonly used grid size for soil sampling in the southeastern U.S. Larger grid sizes of ≥7.5 ac are also frequently used in some fields, and based on the results of this study, that the application accuracy in those fields is only as good as 50% in most cases.
Table 1. Application accuracy (%) and material cost ($/ac) for lime, P, and K for soil sampling at different grid sizes. Data represent values averaged across nine fields.
| Grid size | Application accuracy | Material cost | ||||
|---|---|---|---|---|---|---|
| Lime | P | K | Lime | P | K | |
| ac | ————%———— | ————$/ac———— | ||||
| 1.0 | 89 (9)1a | 86 (8) | 84 (8) | 28.1 | 25.6 | 44.3 |
| 2.5 | 76 (4) | 63 (3) | 60 (1) | 27.5 | 28.1 | 45.9 |
| 5.0 | 73 (3) | 55 (1) | 53 (0) | 27.5 | 33.6 | 42.4 |
| 7.5 | 64 (2) | 57 (1) | 48 (0) | 25.4 | 29.2 | 43.1 |
| 10.0 | 52 (0) | 52 (0) | 49 (0) | 27.2 | 27.3 | 45.1 |
Values in parentheses indicate the number of fields that had application accuracy ≥80%
Economics of Different Grid Sizes
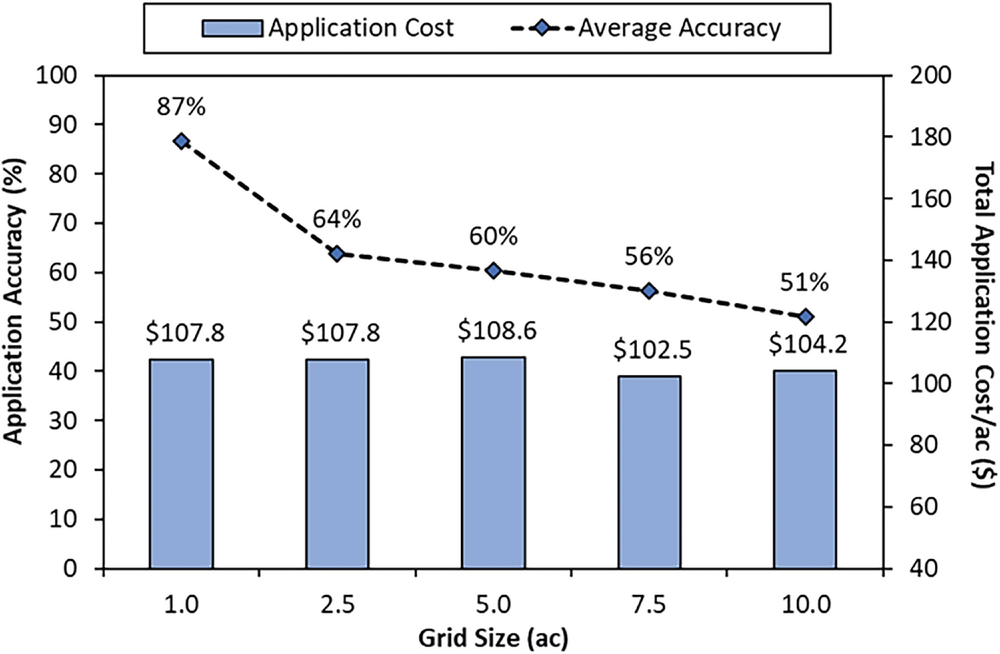
One of the biggest factors for consultants and growers to soil sample using larger grids (≥5 ac) is to reduce the cost as smaller grid size means more soil samples. However, that decision only considers the cost associated with the analysis of soil samples and does not consider the effect of grid size on the material costs (lime and fertilizer). Observing the material costs for different grid sizes in Table 1, the average cost of lime, P and K per acre does not increase linearly with grid size. The material cost ($/ac) for lime for the 1.0-ac grid size is only $0.60/ac more than the cost for the 2.5- and 5.0-ac grid sizes. Similarly, the material cost ($/ac) for P at the 1.0-ac grid size is the lowest among all the grid sizes, whereas for K, it is lower than the cost for 2.5- ac grid size. This is mainly due to the varying amount of under- and over-application associated with each grid size and its effect on material cost. While over-application translates to higher material costs, under-application can result in reduced crop yield potential in some fields; thus, both affecting overall profitability.
Summary
The results from this study indicate that the larger grid sizes (≥5 ac) may help in lowering soil- sampling costs but not without the added expense of reduced application accuracy and even with increased application costs in some fields. The grid size of 1.0 ac is most effective for precision soil sampling to capture the spatial nutrient variability in most fields while also providing the greatest return on investment. The 2.5-ac grid size is another viable option for soil sampling in some fields, depending on the amount of in-field variability. Overall, for precision soil sampling to remain valuable and provide any realistic depiction of soil nutrient levels, grid size should not exceed 2.5 ac in most agricultural fields in the southeastern U.S.
References
Flowers, M., Weisz, R., & White, J. G. (2005). Yield‐based management zones and grid sampling strategies: Describing soil test and nutrient variability. Agronomy Journal, 97(3),968–982.
Hornung, A., Khosla, R., Reich, R., Inman, D., & Westfall, D. (2006). Comparison of site‐ specific management zones: Soil‐color‐based and yield‐based. Agronomy Journal, 98(2),407-415.
Lowenberg‐DeBoer, J., & Erickson, B. (2019). Setting the record straight on precision agriculture adoption. Agronomy Journal, 111(4), 1552–1569.
Walton, J.C., Roberts, R.K., Lambert, D.M., Larson, J.A., English, B.C., Larkin, S.L., Martin, S.W., Marra, M.C., Paxton, K.W., & Reeves, J.M. (2010). Grid soil sampling adoption and abandonment in cotton production. Precision Agriculture, 11(2), 135–147.
Self-Study CEU Quiz
Earn 0.5 CEUs in Nutrient Management by taking the quiz for the article at https://web.sciencesocieties.org/Learning-Center/Courses. For your convenience, the quiz is printed below. The CEU can be purchased individually, or you can access as part of your Online Classroom Subscription.
- _________ is important to accurately detect spatial nutrient variability within agricultural fields and inform __________ applications for site-specific nutrient management.
- Composite soil sampling; variable-rate fertilizer
- Composite soil sampling; uniform, single-rate fertilizer
- Precision soil sampling; variable-rate fertilizer
- Precision soil sampling; uniform, single-rate fertilizer
- Which of the following are effective precision soil-sampling methods?
- Grid sampling.
- Zone sampling.
- Both a and b.
- None of the above.
- For grid soil sampling, smaller grid sizes are recommended to capture the most spatial nutrient variability within the fields.
- True.
- False.
- Generally, ______ grid sizes may help lower sampling costs due to reduced number of soil samples and significantly increase the potential for _________ application of nutrients within a field.
- small; accurate
- small; inaccurate
- large; accurate
- large; inaccurate
- Soil-sampling grid size should not be greater than ________ for an accurate representation of spatial nutrient variability in agricultural fields in the southeastern U.S.
- 1.0 ac
- 2.5 ac
- 5.0 ac
- 10.0 ac
Text © . The authors. CC BY-NC-ND 4.0. Except where otherwise noted, images are subject to copyright. Any reuse without express permission from the copyright owner is prohibited.


