Nitrogen management for irrigated hull-less food barley

In major barley-producing regions of the western United States and Great Plains, nitrogen (N) guidelines for spring malt and feed barley include both soil N and fertilizer N, commonly referred to as N supply. However, the recent development of hull-less, high-fiber barley cultivars has resulted in a lack of specific N management practices. This article presents research from southern Idaho on N management for two-row spring hull-less barley under irrigated high-yielding semi-arid conditions in an effort to establish appropriate N supply rates for hull-less food barley producers. Earn 0.5 CEUs in Nutrient Management by reading the article and taking the quiz. This article was prepared as a contribution of the Western Region Nutrient Management Coordinating Committee (WERA-103).
The development of agricultural and culinary practices throughout human history has led to the relative dominance of corn, rice, and wheat as the major cereal crops produced for direct human consumption in modern societies. Barley ranks a relatively distant fourth in terms of current global production with its primary end-use focused on animal feed and secondary applications for malting and brewing. In the United States, barley production is primarily focused on malting and brewing, followed by animal feed, and finally, direct human consumption.
In contrast to current usage, barley was once a major component of the diets of ancient civilizations in Greece, Rome, Egypt, China, and Scandinavia. The recent resurgence in interest in adding barely to human diets stems from its positive health benefits as a whole-grain food. These benefits are largely due to the high concentration of beta-glucan, a soluble fiber that positively impacts cholesterol (Keenan et al., 2007). The development of hull-less cultivars with high beta-glucan content has minimized the need for pearling the grain before consumption (Hu et al., 2019, Obert et al., 2013). Consumer interest in improved health will solidify high-fiber food barley’s place in healthy modern diets.
In major barley-producing regions of the western United States and Great Plains, nitrogen (N) guidelines for spring malt and feed barley include both soil N and fertilizer N, commonly referred to as N supply. However, the recent development of hull-less, high-fiber barley cultivars has resulted in a lack of specific N management practices. Habiyaremye et al. (2021) conducted research in dryland areas of the Pacific Northwest that determined about 135 lb N/ac was appropriate for hull-less food barleys. While this information is valuable, much of the production in the western U.S., particularly in southern Idaho, occurs under high-input irrigated conditions where agronomic practices and expected output differ from those in dryland areas.
This lack of information for hull-less food barley in irrigated production areas led us to research N management for two-row spring hull-less barley under high-yielding semi-arid conditions. Our objective in this research was to establish appropriate N supply rates for hull-less food barley producers.
Experiment design
Research was conducted over 11 site-years in southern Idaho from 2019 to 2023. Soils were representative of those used for agricultural production in the region with high pH and low soil organic matter. Sites were largely selected for lower residual soil inorganic N (0- to 24-inch depth) content, and additional fertilizer N was applied at approximately five rates, ranging from 0 to 200 lb N/ac.
The N supply discussion in this article will be based on current University of Idaho Extension recommendations, which use N supply = [fertilizer N + inorganic N (ammonium N and nitrate N)]. Other state recommendations and published literature may exclude ammonium N and only use [fertilizer N + nitrate N] in their calculation, and thus we advise the reader to ensure comparable units if comparing to other resources.
Crop harvest was conducted with a small-plot combine to determine grain yield and from which a subsample was used for grain quality, which is not discussed here but can be found in Rogers et al. (2025). Measured grain yield (bu/ac) was compared to N supplies (lb N/ac) to determine the ANOVA critical N supply (CNS = minimum N supply that did not differ from the maximum) for individual site-years and averaged across site-years (Table 1). The ANOVA CNS data were then used to determine the nitrogen requirement (Nr), or the amount of N supply needed per unit grain yield (lb N/bu).
Site year | ANOVA CNS | Grain yield | N responsive |
|---|---|---|---|
| lb N/ac | bu/ac |
|
1 | 183 | 138 | Yes |
2 | 137 | 131 | Yes |
3 | 130 | 113 | No |
4 | 187 | 110 | Yes |
5 | 184 | 97 | Yes |
6 | 150 | 118 | No |
7 | 120 | 115 | No |
8 | 175 | 82 | Yes |
9 | 220 | 91 | Yes |
10 | 195 | 88 | Yes |
11 | 224 | 116 | Yes |
Mean | 173 | 109 | NA |
Standard error | 11 | 5 | NA |
Linear-plateau and quadratic-plateau regressions were used to determine the relationships between N supply and relative grain yield (RGY = treatment mean yield/site-year maximum mean yield) using the entire dataset (Correndo et al., 2023). As the name implies, these two methods utilize linear and quadratic/polynomial models to fit data up to a plateau at which point yield is unchanged by increasing N supply. From this data, we determined the CNS, or the N supply at the point of the yield plateau. For linear- and quadratic-plateau regressions, we calculated the CNS based on 95% RGY. The final N supply recommendations were based on interpretation of the results from the various analytical approaches, including ANOVA, linear-plateau, and quadratic-plateau regression.
Results
Grain yield at 3 of the 11 site-years did not respond to applied fertilizer N (Table 1). These non-responsive sites were relatively high in preplant residual soil inorganic N, which ranged from 120 to 150 lb N/ac compared with responsive sites, which ranged from 24 to 84 lb N/ac. Across sites, the average ANOVA CNS was 173 lb N/ac with grain yields that ranged from 82 to 138 bu/ac.
For perspective, current recommendations for feed barley in the region are up to an N supply maximum of 240 lb N/ac (Robertson & Stark, 2003). These current recommendations follow a yield-based approach with N supply rates based on a nitrogen requirement (Nr, lb N/bu). Current extension recommendation Nr ranges from 1.8 to 1.5 lb N/bu in the yield range of 80 to 140 bu/ac. Therefore, current recommendations would result in N supply recommendations of 140 and 210 lb N/ac for 80 and 140 bu/ac yields, equating to an N supply range of 70 lb N/ac. Regression of ANOVA CNS and grain yield at individual sites in the current study indicated a steeper change in Nr ranging from 2.0 to 1.2 lb N/bu (Figure 1). These Nr values would correspond to <10 lb N/ac variation in N supply recommendations across the same 80 to 140 bu/ac yield range.
![Figure 1. Nitrogen requirement (Nr, N supply [lb N] per unit grain yield [bu] calculated based on ANOVA critical N supply [CNS] from Table 1 for 11 site-years of hull-less food barley nitrogen response data from southern ID.](https://www.agronomy.org/files/images/publications/crops-and-soils/2025/june/nitrogen-management-hullless-barley-fig1.png)
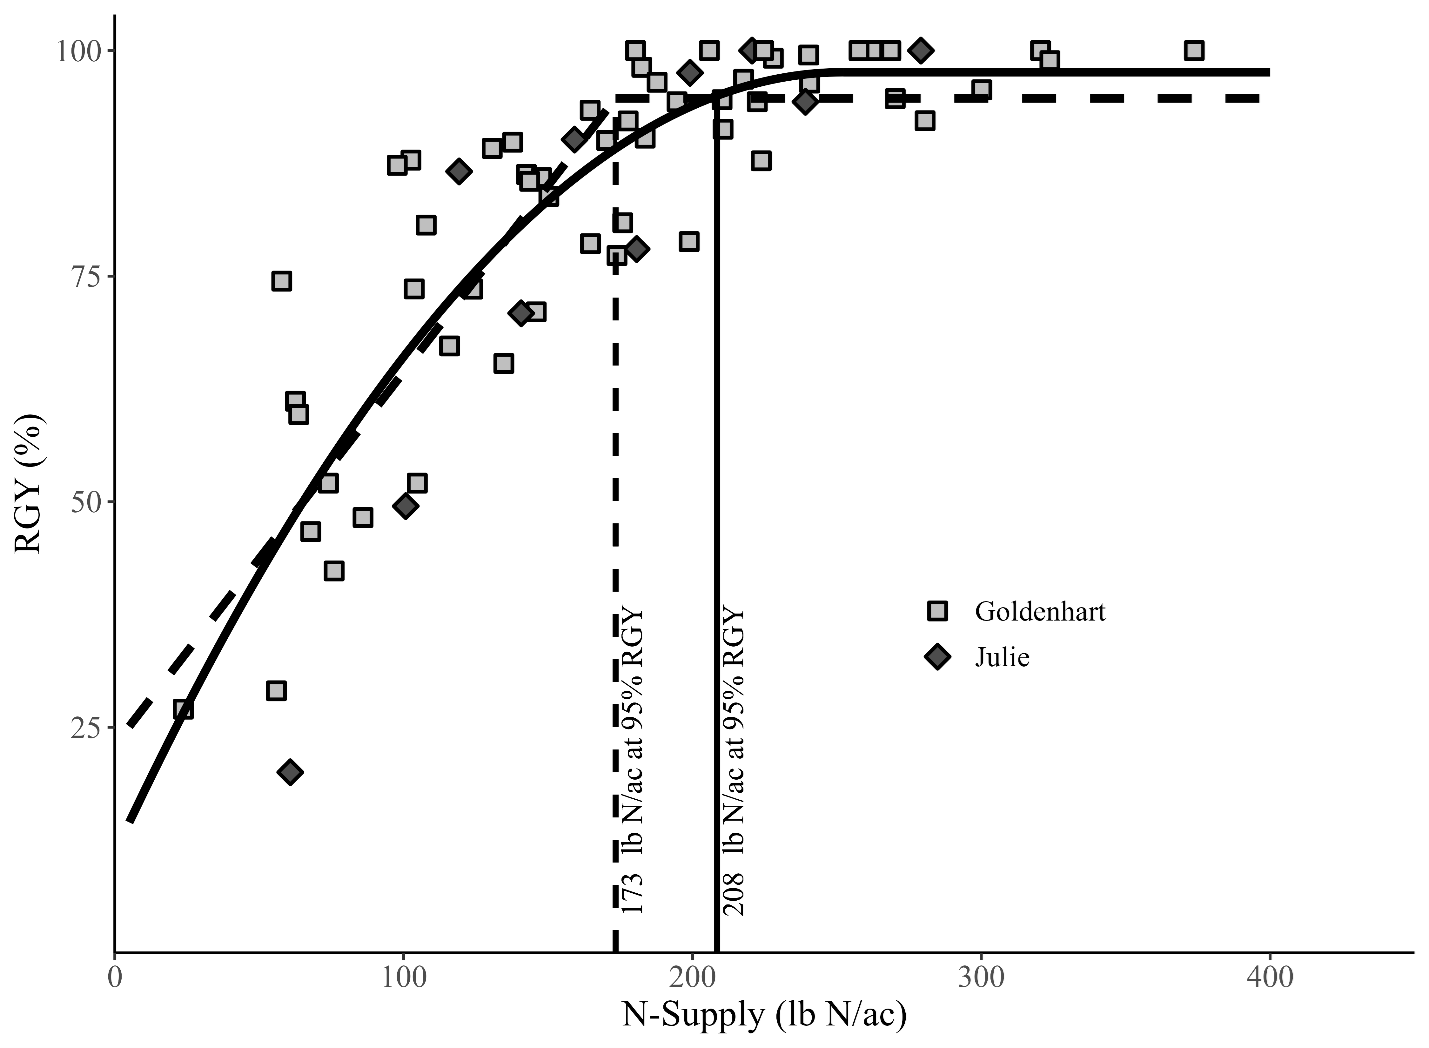
Data from all site-years were subjected to further analysis through regression to calculate a site-wide CNS using RGY (Figure 2). The data were first fit using the more conservative linear-plateau model, which resulted in a CNS of 173 lb N/ac with a plateau at 95% RGY. This is similar to the mean from the ANOVA CNS (Table 1) and relatively similar to N recommendations from North Dakota (Franzen, 2023). The quadratic-plateau analysis identified a plateau of 98% RGY, which we interpreted at 95% RGY, resulting in a CNS of 208 lb N/ac. The varied statistical approaches used in this study seek to more accurately describe the response and account for variation in production conditions (Hochmuth et al., 2011). From these approaches, a relatively narrow range of N supplies for food barley of 173 to 208 lb N/ac was determined.
No specific recommendations are currently available for hull-less food barley in irrigated semi-arid environments, and thus, this study provides valuable guidance to improve production practices and economic returns for growers. Overall, results of this support a static N range approach, which is a relatively narrow and consistent range of N supplies that are needed regardless of grain yield levels. These results align with North Dakota’s barley recommendations (Franzen, 2023) as well as recently revised sugarbeet recommendations from the region that use a similar non-yield-based approach (Tarkalson et al., 2025). A static N range approach is supported by our data, but reduced N may be appropriate at the farm level based on local conditions associated with known environmental factors that would include water quantity/quality, lodging, shattering, residue management, etc.
While not readily quantified through soil testing, N mineralization is of particular note in the region as wide variation has been observed, and thus, local knowledge should be considered if available (Rogers et al., 2018). From a practical standpoint, our data indicate that a static N range from 175 to 210 lb N/ac would be appropriate for two-row spring hull-less food barley in the region and other comparable semi-arid environments.
Correndo, A. A., Pearce, A., Bolster, C. H., Spargo, J. T., Osmond, D., & Ciampitti, I. A. (2023). The soiltestcorr R package: An accessible framework for reproducible correlation analysis of crop yield and soil test data. SoftwareX, 21, 101275. https://doi.org/10.1016/j.softx.2022.101275
Franzen, D.W. (2023). Fertilizing malting and feed barley. North Dakota State University Extension.
Habiyaremye, C., Schroeder, K. L., Reganold, J. P., White, D., Packer, D., & Murphy, K. M. (2021). Effect of nitrogen and seeding rate on β-glucan, protein, and grain yield of naked food barley in no-till cropping systems in the Palouse region of the Pacific Northwest. Frontiers in Sustainable Food Systems, 5, 663445. https://doi.org/10.3389/fsufs.2021.663445
Hochmuth, G., Hanlon, E., & Overman, A. (2011). Interpretation for developing fertilization recommendations–Examples with vegetable crop research. University of Florida Agriculture System Extension.
Hu, G., Evans, C. P., Satterfield, K., Ellberg, S., Marshall, J. M., Schroeder, K., & Obert, D. E. (2019). Registration of ‘Goldenhart’, a two-rowed spring food barley. Journal of Plant Registrations, 13(2), 119–122. https://doi.org/10.3198/jpr2018.10.0067crc
Keenan J.M., Goulson M., Shamliyan T., Knutson, N., Kolberg, L., & Curry, L. (2007). The effects of concentrated barley beta-glucan on blood lipids in a population of hypercholesterolaemic men and women. British Journal of Nutrition, 97(6), 1162–1168. https://www.doi.org/10.1017/S0007114507682968
Obert, D. E., Hang, A., Hu, G., Burton, C., Satterfield, K., Evans, C. P., Marshall, J. M., & Jackson, E. W. (2013). Registration of ‘Julie’ high ί-glucan spring barley. Journal of Plant Registrations, 7(1), 1–4. https://doi.org/10.3198/jpr2011.12.0639crc
Robertson, L. D., & Stark, J. C. (2003). Idaho spring barley production guide (Bulletin no. 742). Idaho Agricultural Experiment Station.
Rogers, C.W., Schroeder, K., Rashed, A. and Roberts, T.L. (2018). Evaluation of soil tests for measuring potentially mineralizable soil n in southern Idaho Soils. Soil Science Society of America Journal, 82, 1279–1289. https://doi.org/10.2136/sssaj2018.01.0054
Tarkalson, D.D., Olsen, D., Bjorneberg, D., & Rogers, C.W. (2025). The case for static range nitrogen management in Idaho sugarbeet production. Soil Science Society of America Journal. https://doi.org/10.1002/saj2.70025
Dig deeper
Rogers, C.W., Spackman, J.A., Tarkalson, D.D., Hu, G., Marshall, J.M., Adeyemi, O.E., & Evans, C. (2025). Irrigated spring hull-less food barley response to nitrogen fertilization. Soil Science Society of America Journal, 89, e70029. https://doi.org/10.1002/saj2.70029
Self-study CEU quiz
Earn 0.5 CEUs in Nutrient Management by taking the quiz for the article. For your convenience, the quiz is printed below. The CEU can be purchased individually, or you can access as part of your Online Classroom Subscription.
What specific compound found in food barley is beneficial to human health?
a. Beta-fructan.
b. Beta-glucose.
c. Beta-glucan.
d. Beta-dioxide.
How was relative grain yield (RGY) calculated?
a. = Control treatment mean yield/numerical maximum mean yield.
b. = Control treatment mean yield/site average yield.
c. = Numerical maximum mean yield/control treatment mean yield.
d. = Numerical maximum mean yield/ site average yield.
How were barley nitrogen (N) recommendations calculated in the current study?
a. N supply = (total N + fertilizer N).
b. N supply = (total N – inorganic N + fertilizer N).
c. N supply = (inorganic N – fertilizer N).
d. N supply = (inorganic N + fertilizer N).
What is the critical N supply, or CNS, in relation to crop response?
a. CNS is the rate at which response begins to occur.
b. Crops respond to additional N supply below CNS.
c. Exceeding CNS will result in immediate crop failure.
d. CNS is the N supply at which maximum profit is made.
What is the definition of a static N range approach?
a. Grain yields are multiplied by N requirements to determine N supply.
b. The same amount of fertilizer N is always applied.
c. Nitrogen is assumed to be consistent year-to-year.
d. Nitrogen supplies are recommended within a narrow and consistent range regardless of yield.
Text © . The authors. CC BY-NC-ND 4.0. Except where otherwise noted, images are subject to copyright. Any reuse without express permission from the copyright owner is prohibited.


