Imbalanced Data From U.S. Cotton Variety Test

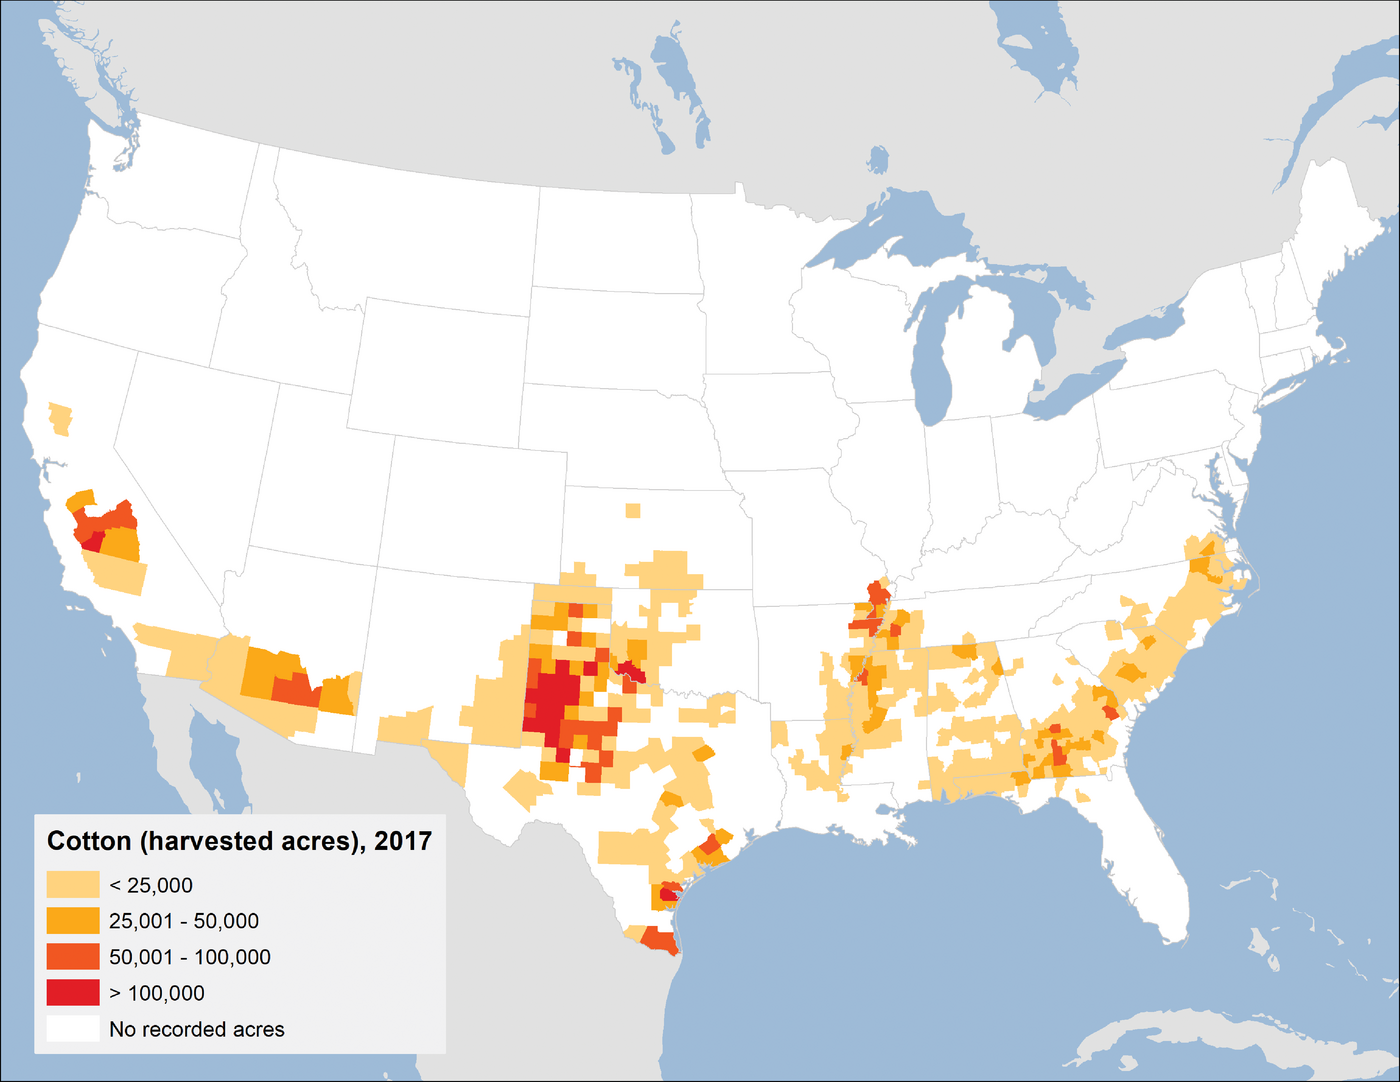
Since the 1960s, the USDA National Cotton Variety Test (NCVT) has tested more than 1,300 varieties and breeding lines over six growing regions in the U.S. Cotton Belt. Data from this rich multi‐environment trial (MET) are used to compare entries and evaluate the genetic and agronomic development, referred to as the long‐term trend, in cotton production over the decades.
In the literature, linear mixed models (LMM) have been widely used to analyze the short‐term MET data, mostly balanced (i.e., all varieties tested at all environments). However, for a long‐term project such as NCVT, many old variety entries drop out each year and are replaced by new entries, leading to highly missing variety‐by‐year combinations. The resulting extreme imbalance challenges the validity of the results from fitting an LMM.
A simulation study investigated how the imbalance caused by various dropouts affects the estimation of model parameters and prediction of the variety’s overall and local performances. Estimation of long‐term trends was found to be most affected by the imbalance among all parameters. Including the long‐term trend in the LMM is crucial for cotton performance prediction and should be implemented in other long‐term crop variety test trials.
Adapted from
Fang, Z., Deng, D. D., Jenkins, J. N., & Zhou, Q. M. (2024). An investigation of the impact of imbalance on the analysis of the US crop variety evaluation program data. Crop Science, 64, 2183–2194. https://doi.org/10.1002/csc2.21262
Text © . The authors. CC BY-NC-ND 4.0. Except where otherwise noted, images are subject to copyright. Any reuse without express permission from the copyright owner is prohibited.


