Empowering Research: A Guide to Useful Open-Source Data
Field crop research requires understanding of various crop production variables and their interactions. In the practical world, it’s nearly impossible for specific labs or graduate students to collect all the observable data. This is due to the crops’ short growing cycles, limited funding for the specific research objectives, and the time‐consuming nature of data collection. In such cases, open‐source data can support scientific investigations and conclusions.
In simple words, open‐source data is the data that anyone can access, use, and share with limited or no restrictions, proper permission, and credits. Open‐source resources are critically important for the effect of research, facilitating the reproducibility of research work and collaborations. Universities, state agencies, and institutes host access to such resources. Students can access these data from the application programming interface and use it to support their findings. Open‐source tools such as localized weather, soil, satellite, and geographic information system data can help better understand the crop production system and consideration of multiple variables. This article is an effort to share some open‐source resources and their access platforms that can help graduate students’ research and publications.
Open‐source data have become key tools in advancing agricultural research and supporting their findings. Researchers can explore new ideas and methods without worrying about the cost or restrictions of recorded data. By combining information from different open‐source data sources, researchers can do more detailed studies, which leads to stronger and more trustworthy results. For example, by using weather or soil data, researchers can better understand how different factors affect crop growth and responses.
Open‐Source Resources
Local Resources
Accessing locally available resources is critically important and crucial as graduate students have better reference points or personnel to help them with these data collections. In some research stations, site‐specific soil physical and chemical analyses are conducted, which can help establish pre‐sowing crop conditions. The record books of the research station can also be a good reference point for understanding the site history, cropping pattern, cover crop, and nutrient application cycles. Research stations also maintain records of the weather parameters such as rainfall, temperature, and humidity. The records of the rest of the cultivation practices, with time, can facilitate the development of new research proposals and their implications for soil and crop systems.
Soil Resources
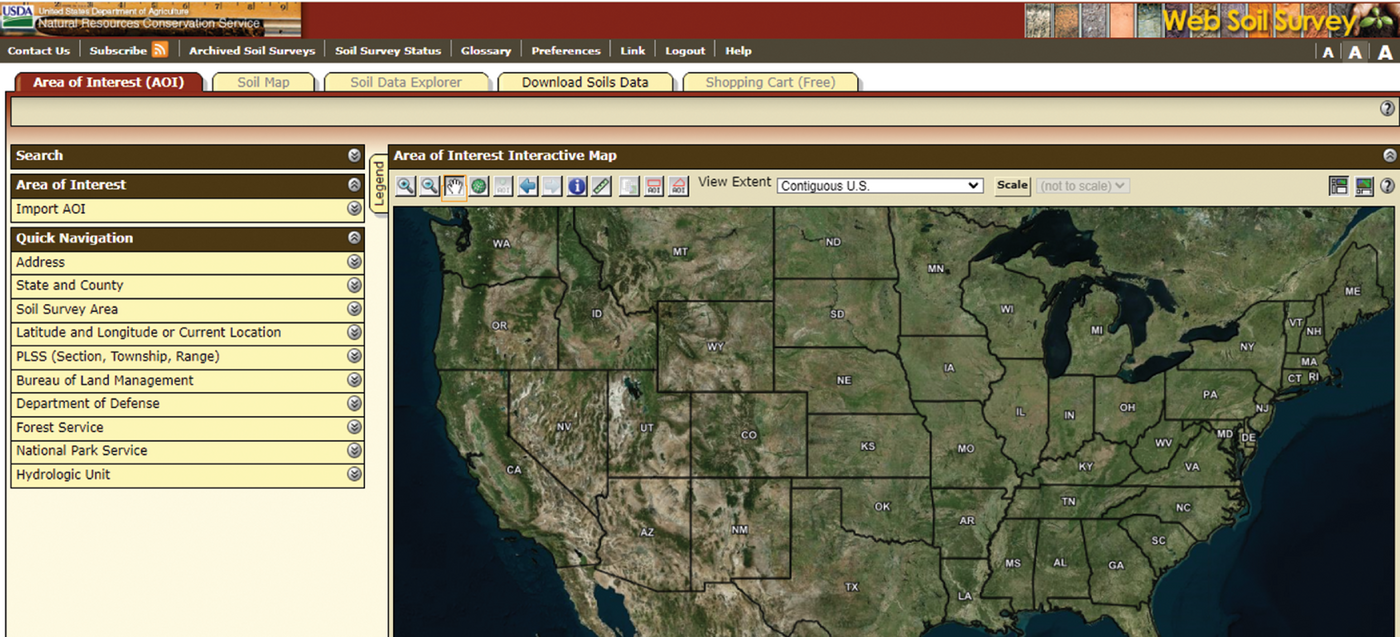
Localized soil information, such as series and order, is vital for understanding the soil’s chemical, physical, and biological properties. The detailed soil information can be accessed at the Soil Survey Geographic Database (SSURGO; https://bit.ly/3yzjje5) or Web Soil Survey (https://bit.ly/46O9TYN; Figure 1) and are provided by USDA‐NRCS. The other open‐source data for soil information can be accessed at https://gee‐community‐catalog.org/projects/polaris/, which provides information on the soil properties at a 30‐m mapped resolution. This platform uses the probabilistic remapping of the SSURGO data with soil properties such as soil texture, bulk density, saturated soil water content, residual soil water content, saturated hydraulic conductivity, soil pH, organic matter, pore size distribution index, bubbling pressure, measure of pore size distribution and scale parameter inversely proportional to mean pore diameter (Chaney et al., 2019).
Weather Data Resources
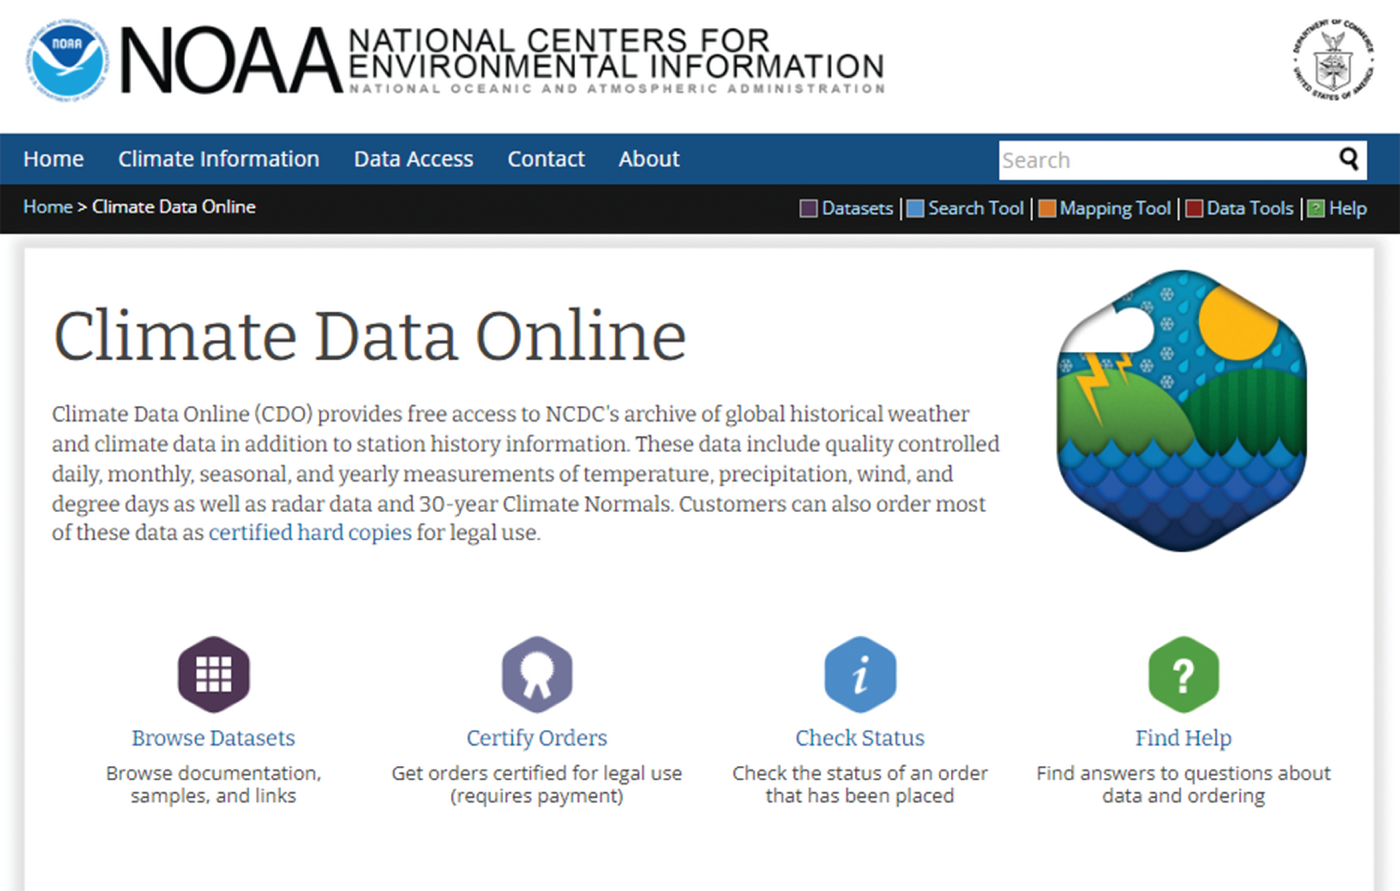
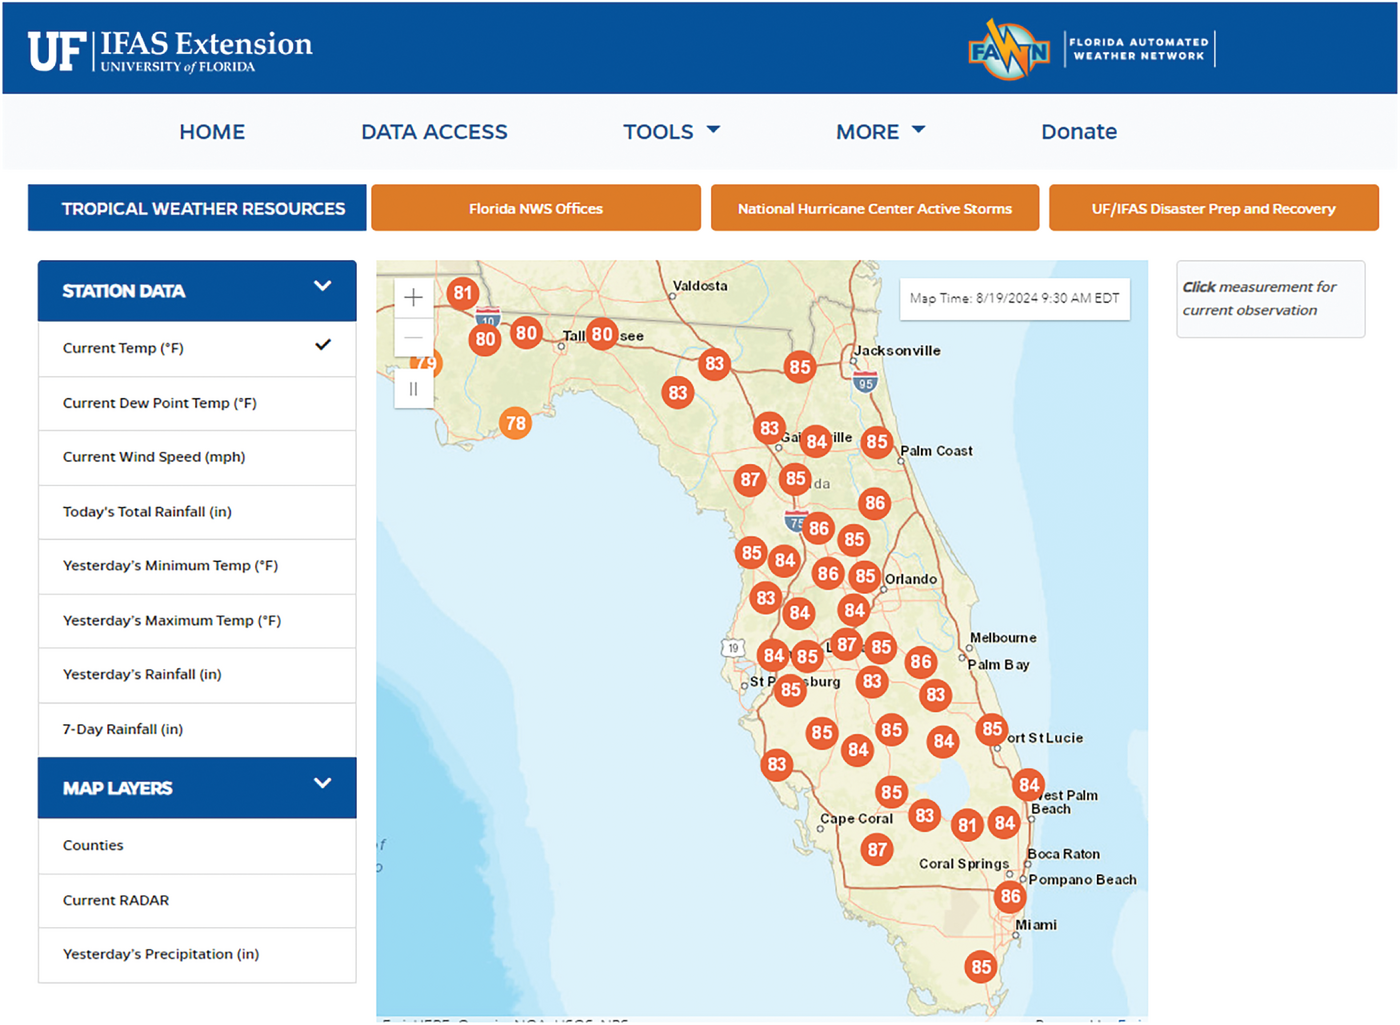
Weather parameters include temperature, relative humidity, solar radiation, dew temperature, wind speed, precipitation, and soil moisture. These parameters influence crop growth, yield, and responses to the experimental treatments. Reporting weather parameters helps researchers discuss soil, crop production, and biotic and abiotic stress responses. Weather data can be accessed from different platforms such as NASA POWER (https://power.larc.nasa.gov/data‐access‐viewer/), Midwest Regional Climate Center (https://mrcc.purdue.edu/), High Plains Regional Climate Center (https://hprcc.unl.edu), NOAA (https://www.ncei.noaa.gov/cdo‐web/; Figure 2), and FAWN (https://fawn.ifas.ufl.edu/; Figure 3).
Satellite- and Airborne-Imaging Data
Satellite‐imaging data report crop canopy or ground reflectance data that can be used to monitor crop growth and health. Plant phenotyping based on satellite imaging is used in crop yield prediction, nutrient response, crop response to irrigation, and many other applications. Multiple satellite‐ or airborne‐imaging data are available for researchers to use. Satellite‐imaging products of Landsat (30‐m resolution) and Sentinel (10‐m resolution) can be used to study large areas of interest; however, for small‐plot experiments, the imaging product of Planet.org can help for research purposes. These images have a higher ground resolution (3 m) and temporal resolution than Landsat and Sentinel. Under the National Agricultural Imaging Project (NAIP), the airborne 50‐cm resolution multispectral images are captured and can be accessed and used by researchers for long‐term research objectives to monitor the ecosystems, land use, and management. The imaging products from Landsat, Sentinel, NAIP, and others can be accessed from the USGS (https://earthexplorer.usgs.gov/; Figure 4), and Planet satellite‐imaging products can be accessed free with their Education and Research Program (https://www.planet.com/industries/education‐and‐research/). The GIMMS Global Agricultural Monitoring (GLAM) system (https://glam1.gsfc.nasa.gov/) is another important system that provides near real‐time and science quality data on normalized difference vegetation index (NDVI), a common vegetation index used to assess several crop metrics.
GIS Resources
In recent years, the application of geographic information systems (GIS) in agronomy, crop, and soil sciences has increased, where multiple research products can be fused on a spatial scale, and researchers can see it in interactions with other variables. Various state and federal agencies host open‐source GIS data that can be used according to research interests. It is recommended to check what GIS resources are available for the study location and take advantage of them. For example, the Florida Department of Environmental Protection (FDEP) hosts different GIS products, which are from the administrative boundaries, atmosphere, climate data, and so on (Florida Department of Environmental Protection Geospatial Open Data). Similar GIS products can be accessed through the Florida Geographic Data Library (https://fgdl.org/fgdlmap/). This kind of dataset can help researchers make a new investigation using the varied approach or integrate this observation in the field‐reported variables.
Conclusions
The growing availability of open‐source data in crop research has increased the possibility of using this information, which can facilitate more conclusive findings supported by additional information. The application of the above‐mentioned open‐source data encourages platforms and agencies to make more data available for research purposes and supports the efforts of the scientific community.
We’d love to hear your thoughts on this article! Your feedback helps us make future editions even better. Please let us know what you think about the content, clarity, and usefulness. You can send your feedback to ayushsharma@ufl.edu or use our feedback form at https://forms.gle/3LAmFbjpb92RY8A3A. Thank you for your time and input!
Reference
Chaney, N. W., Minasny, B., Herman, J. D., Nauman, T. W., Brungard, C. W., Morgan, C. L., … & Yimam, Y. (2019). POLARIS soil properties: 30‐m probabilistic maps of soil properties over the contiguous United States. Water Resources Research, 55(4), 2916–2938. https://doi.org/10.1029/2018WR022797
Connect With Us!
If you would like to give us feedback on our work or want to volunteer to join the committee to help plan any of our activities, please reach out to Ariana Lazo (alazo@purdue.edu), the 2024 chair of the committee!
If you would like to stay up to date with the ACS Graduate Student Committee, learn more about our work, contribute to one of our CSA News articles, or suggest activities you would like us to promote, watch your emails and connect with us on Twitter, now called X, (@ACSGradStudents), Facebook (ACS.gradstudents), or visit: agronomy.org/membership/committees/view/ACS238/members, crops.org/membership/committees/view/ACS238/members, or soils.org/membership/committees/view/ACS238/members.
Text © . The authors. CC BY-NC-ND 4.0. Except where otherwise noted, images are subject to copyright. Any reuse without express permission from the copyright owner is prohibited.


