Data Analytical Skills in Agricultural Science
Growing Knowledge, Training in Emerging High-Throughput Techniques and Machine-Learning Applications

A United Nations (2022) report by the Department of the Social and Economical Bureau has predicted the world population is going to be around 10 billion by 2050 and will be required to produce 70% more food than what is currently produced. To meet such a high demand for food, we have to improve crop performance and productivity through different crop improvement and breeding programs. The precise trait phenotypes and environmental factors are bottlenecks for traditional breeding programs. To tackle these issues, in recent years, high‐throughput phenotyping and sequencing techniques have been adopted to screen the crop phenotypes and their genetic makeup to elucidate the genetic architecture of complex traits, controlling important agronomic traits that can help to optimize crop yield with better adaptation and tolerance in different environments.
Let’s explore the high‐throughput phenotyping and sequencing techniques and their advantages and challenges.
High‐Throughput Phenotyping
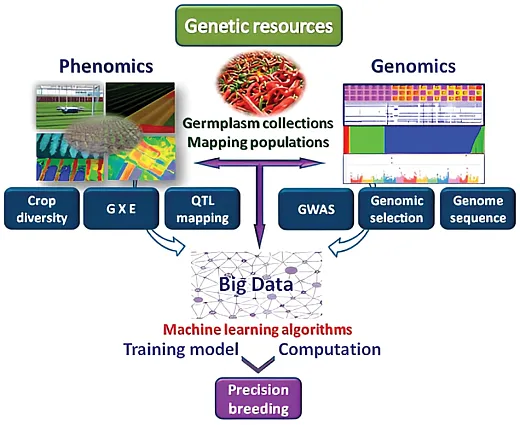
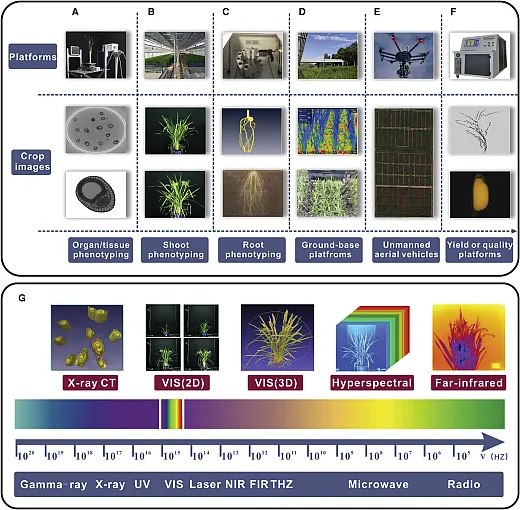
High‐throughput phenotyping (HTP) is a method of measuring the numerous phenotypic characteristics related to plant growth, yield, phenology, and abiotic and biotic stress tolerance through non‐invasive, low‐cost, and rapid approaches. Plant phenotypes are the complex traits resulting from the interaction between genotype and environments. There is a need for a massive screening of populations for desirable phenotypes in different environments to optimize crop production. The major HTP methods include imaging, remote sensing, sensors, and mass spectroscopy among others.
There are different approaches for imaging of plants such as remote sensing, which includes satellite imagery, unmanned aerial vehicles (UAVs), mobile robots, phones, and cameras. Remote‐sensing platforms with appropriate sensors allow the collection of images in different spectral bands for large areas that can be analyzed to assess different abiotic and biotic factors. The most common images are RGB, multispectral, hyperspectral, and thermal images. Different images have the capacity to capture the different symptoms and stresses like multispectral and hyperspectral images suitable for disease and pest detection. Some other imaging techniques are mobile vehicles equipped with powerful chips and sensors based on the internet of things (IoT) for rapid and smooth data transformation. They can be utilized during the season to inspect the plant health in different fields (Fuentes et al., 2017; Selvaraj et al., 2019).
High‐Throughput Genotyping and Sequencing
High‐throughput genotyping (HTG) is a method of genotyping the multiple genetic loci across the hundreds to thousands of samples in a population to study the genetic variations through markers and alleles. It helps to gain insights into the genetic makeup of complex traits and their response in different environments and find the beneficial or causal alleles of a particular trait. The most common HTG method is single nucleotide polymorphism (SNP) genotyping. The HTG is used for genome‐wide association studies (GWAS) and quantitative trait loci (QTL) mapping to identify the markers related to targeted traits such as yield, drought and heat tolerance, disease and pest resistance, and other environmental factors. This allows for breeding of improved cultivars in a changing climate and environment or of livestock to improve the dairy and meat quality. The HTG has also been useful in the study of ecological and evolutionary adaptation of traits and crops in different environments and geographical locations.
With the rise of next‐generation sequencing (NGS) technology and the revolution in plant biotechnology, much attention has been drawn into exploring the genetic constitution of crops and generating the reference genomes to find the stress tolerance and high‐yielding genes and related markers in wild and domesticated crops. High‐throughput sequencing (HTS), also known as NGS, can sequence large amounts of DNA or RNA in a short time at low costs. It has revolutionized crop improvement programs by accelerating breeding through the identification of molecular markers linked to desired traits and thus making the marker‐assisted selection fast, accurate, and efficient. Overall, HTP and HTG have led to the development of high‐yielding crop varieties that are resilient to abiotic and biotic stress. Even though HTS and HTG are highly beneficial in crop improvement, management and analysis of data remain a primary challenge.
Data Revolution: Need for Data Analytical Skills
The development of high‐throughput techniques and the explosion of data collection capabilities from various aspects of agriculture have resulted in a massive amount of data and information that may remain untapped. Extensive data analytical skills are required to effectively harness the potential of such large datasets. Systematically collected data through high‐throughput technology are invaluable resources to understand the underlying process and management of various aspects within agricultural systems. However, the collected data are often in complex form and contain several hidden insights. Extracting accurate and reliable information from such complex datasets using traditional analytical methods can be overwhelming. Even with the latest available analytical methods, the information extraction process can be time‐consuming and prone to error due to lack of appropriate skills for analysis. With the advancement in technologies and data, it has become imperative that researchers equip themselves with and/or bridge the gap in data analytical skills to address the challenges of dynamic and ever‐changing agriculture systems.
Machine‐Learning Approaches
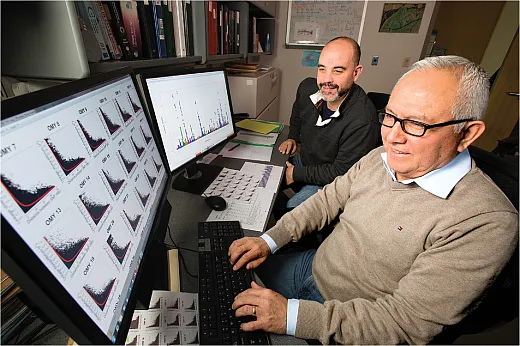
Due to the generation of large data sets in HTP and HTS, data‐processing and analysis techniques based on machine learning are widely used. Machine learning is an interdisciplinary method that uses mathematical and statistical tools like probability, classification, regression, clustering, entropy, computer vision, neural networks, and different data visualization techniques for data analysis and visualization. Machine‐learning methods can be categorized into two groups: supervised machine learning, requiring label data for training models, and unsupervised machine learning, requiring no label data for training the models and simply using the hidden patterns and data grouping. Label data is a trait of a crop that can be quantitative data like height or yield or qualitative data like images of plants, diseases, and stressed organs. Supervised learning is used for solving classification and regression problems while unsupervised learning is used for solving clustering, dimensionality reduction, and association mapping of data. Some of the powerful machine‐learning techniques, which can be used as supervised and unsupervised, are neural networks, support vector machine, regression, random forest, clustering, and dimensionality reduction techniques.
Neural Networks
Neural networks are the mathematical model inspired by the structure and functioning of biological neurons. Neural networks consist of different layers that are interconnected with nodes that perform mathematical operations like weighted sums and activation functions. Neural network training adjusts the weights and biases to minimize the loss function through back propagation and gradient descent. They can be used for both supervised and unsupervised learning of data.
The major neural networks used in high‐throughput data analysis are convolutional neural networks (CNN), recurrent neural networks (RNN), and artificial neural networks (ANN). Large numbers of images generated through HTP can be analyzed through neural networks like CNN and RNN for prediction and quantification of the traits like plant growth, yield, leaf area, root traits, pests, diseases, drought, heat, and other stress symptoms (Khaki et al., 2020; Singh et al., 2016). Neural networks are also used to differentiate crop types, plant parts, and segmentation of root images for measurement of the root traits. Convolutional neural networks are also used to detect the sequence variation in the high‐throughput sequence data by visualizing each sequence to explore the complex genetic variation and architecture of organisms. Further, they are actively used in identification of biomarkers, sub‐cell types, gene regulatory networks, 3D protein structure and changes prediction, and gene groups contributing to the different complete traits.
Support Vector Machine
Support vector machine (SVM) is a powerful machine‐learning tool that uses the hyperplane as a linear separator with the largest margin to separate the data. Many studies have used SVM to train the model for disease and stress identification.
Regression
Regression is used for estimation of quantitative traits like yield, growth rate, leaf area, and physiological and morphological traits and to extract meaningful insights from the large datasets. Input data are needed to train a regression model, and predictions are based on it. There are different forms of regression that are actively used in machine‐learning techniques such as linear regression, multiple regression, Bayesian regression, time series regression, etc. Linear regression is frequently used for high‐throughput data analysis of gene expression data, agronomic data, weather data, etc. It is used to study how different variables are interlinked together and make a prediction model incorporating these variables. The multiple‐regression model allows the use of multiple variables for regression analysis to gain insight into the data having many independent variables. There are different ways of tuning the regression model to reduce the over‐fitting and biases like ridge and lasso regression.
Clustering
Clustering is another powerful machine‐learning technique that can be used as supervised and unsupervised learning. It is used to cluster the groups based on certain characteristics, which can help to explore the hidden trends and classes. The major clustering techniques are k‐means clustering, hierarchical clustering, density‐based clustering, distribution‐based clustering, etc. Clustering is used to group the genotype based on the performance of certain traits that are highly significant for some environmental adaptation or stress tolerance.
Random Forest
Random Forest is a classification technique that uses the ensemble learning method to combine the multiple decision trees and perform tasks like classification, regression, etc. It is used for segmentation and classification of images to detect different desirable traits.
Correlation and Causation in Agricultural Science
One of the biggest issues while working with high‐throughput data where there are a large number of variables is the issue of correlation and causation. Due to the large number of variables and large data size, there is a high likelihood of finding correlation even if they are not technically correlated or are not caused by one another. Sometimes the correlation is driven by the third variable, but we are unable to find the factor. Data snooping or data dredging can be a big issue when we try to use multiple statistical tools until we find significant results to support our hypothesis. Confounding data is another issue when we try to correlate distant data. For example, while comparing the molecular traits vs. macroscopic traits like canopy coverage, evapotranspiration, vegetation index, etc., there can be significant correlation, but there may not be a true causation. Random chance can also lead to correlation. Sometimes the relation at the microlevel or individual level does not imply the relation at the broad or group level like the case of Simpson’s paradox. Thus, it is highly important to have a good domain knowledge and proper understanding of statistical tools used for the analysis while dealing with big data.
Navigating Resources and Trainings for Data Analytical Skills

As data analytical skills are becoming an essential part of research, relevant resources and training are being developed to equip people with essential skills. Statistics or other departments in college often offer courses on data analytical skills. Students, while at a university, should explore and enroll in the available courses offered by different relevant departments. In addition, they should always look out for different training and workshops that are offered at universities, scientific conferences, and some private institutions. Opportunities, whenever available, to engage in an internship, or collaboration with industry and interdisciplinary teams, can help students gain practical and real‐world experience of data analytical skills under the guidance of expert mentors.
Several programming languages commonly used in data analytics are open source, which are often free to use, such as Python, R, Apache Spark, KNIME, etc. Other programs like Tableau, QlikView, and Power BI are free to use with limited functionality while programs like SAS and MATLAB require a paid license. Most universities offer free licenses to several programs through their information technology department. Online learning platforms like DataCamp, edX, Coursera, etc., offer a wide range of courses to get hands‐on skills in the aforementioned programs.
Summary
The expansion of research in agriculture harnessing the capabilities of advanced tools and technologies will ultimately result in a massive volume of data. A revolution in agricultural research has been sparked by the integration of high‐throughput methods with machine‐learning applications that have data analytics serving as the foundation. The skill to navigate its complexity, distinguish between correlations and casualties, and use machine learning to reveal hidden patterns is needed to unleash the potential within data. Investing resources and time to learn appropriate skills to work with big data will provide tremendous opportunities for people in academia and industry to develop knowledge and tools and advance agricultural science.
CONNECTING WITH US
If you would like to give us feedback on our work or want to volunteer to join the ASA, CSSA, and SSSA (ACS) Graduate Student Committee to help plan any of our activities, please reach out to Maria Teresa (mariateresa.tancredi@uga.edu), the 2023 chair of the committee!
If you would like to stay up to date with our committee, learn more about our work, contribute to one of our CSA News magazine articles or suggest activities you would like us to promote, watch your emails, connect with us on Twitter (@ACSGradStudents) and Facebook (ACS.gradstudents), or visit: agronomy.org/membership/committees/view/ACS238/members, crops.org/membership/committees/view/ACS238/members, or soils.org/membership/committees/view/ACS238/members
If you are attending the 2023 ASA, CSSA, and SSSA (ACS) Annual Meeting in St. Louis, don’t forget to check out the workshop, tour, and special sessions organized by our ACS Graduate Student Committee and come meet us at our in‐person meeting—look for the Graduate Student Committee Meeting on the agenda!
References
Esposito, S., Carputo, D., Cardi, T. & Tripodi, P. (2019). Applications and trends of machine learning in genomics and phenomics for next‐generation breeding. Plants, 9(1), 34.
Fuentes, A., Yoon, S., Kim, S.C. & Park, D.S. (2017). A robust deep‐learning‐based detector for real‐time tomato plant diseases and pests recognition. Sensors, 17(9), 2022.
Khaki, S., Wang, L. & Archontoulis, S.V. (2020). A CNN‐RNN framework for crop yield prediction. Frontiers in Plant Science, 10, 1750.
Selvaraj, M.G., Vergara, A., Ruiz, H., Safari, N., Elayabalan, S., Ocimati, W., & Blomme, G. (2019). AI‐powered banana diseases and pest detection. Plant methods, 15, 1–11.
Singh, A., Ganapathysubramanian, B., Singh, A.K., & Sarkar, S. (2016). Machine learning for high‐throughput stress phenotyping in plants. Trends in Plant Science, 21(2), 110–124.
United Nations. (2022). World population prospects 2022: data booklet. Department of Economics & Social Affairs. https://population.un.org/wpp/Graphs/DemographicProfiles/Line/900
Yang, W., Feng, H., Zhang, X., Zhang, J., Doonan, J. H., Batchelor, W. D., Xiong, L. & Yan, J. (2020). Crop phenomics and high‐throughput phenotyping: past decades, current challenges, and future perspectives. Molecular Plant, 13(2), 187–214.
Text © . The authors. CC BY-NC-ND 4.0. Except where otherwise noted, images are subject to copyright. Any reuse without express permission from the copyright owner is prohibited.


