Research Update: More Uses for Electrical Resistivity Tomography
Back in July 2022, we told you about how researchers in Switzerland assessed electrical resistivity tomography (ERT) as a tool for detecting rainfall‐induced landslides. The researchers determined that ERT is not only effective as a moisture sensor, but also offers many advantages over similar tools.
Recently, another European team of researchers, this one working just north of Switzerland in the southern German state of Bavaria, deployed ERT in combination with other techniques to study soil moisture changes throughout a year in a different terrain: a forest under drought stress. University of Würzburg researchers Julia Rieder and Christof Kneisel sought to better understand the drought’s effects on a mixed stand of Scots pine and European beech.
The goal in ERT is to use electricity to probe what lies below the surface. The technique allows scientists to do multiple measurements over time within the study area without having to dig a bunch of holes and to measure across the whole area rather than just at specific points. After arranging cables and electrodes on and/or under the soil in a particular configuration tailored to the study’s objectives, researchers run a current underground, regularly measure resistivity across the targeted area (in the German study, measurements were taken almost weekly), and then manipulate that data to home in on the parameters of interest.
Numerous factors can affect resistivity. Soil type plays a role: Sandy soils have higher resistivity than clay soils, for example. In addition, salinity, temperature, and pore structure have an impact with higher resistivity associated with lower salinity, higher temperature, and a more open soil pore structure.
Because the German researchers were interested specifically in measuring water content over time with ERT, they needed to use other tools to measure the other factors influencing resistivity. So, they did soil analyses and weather monitoring to acquire that information, which allowed them to interpret the ERT results for soil moisture changes in the ~2,000 m2 area they tested.
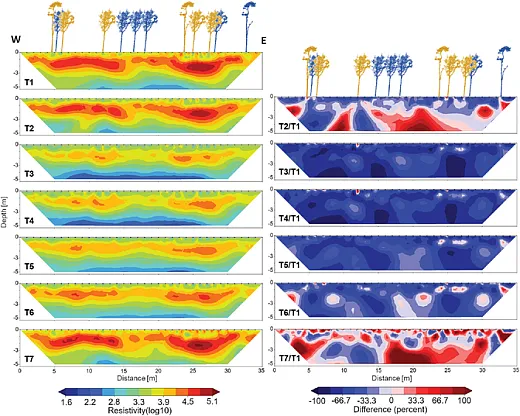
With the resistivity measurements, they generated a cross‐section of the underground area called a tomogram—essentially a map of the subsurface in which different colors represent different resistivity values. The tomograms in Figure 1 show how the resistivity in the northern Bavarian forest plot changed over the course of a year.
In Vadose Zone Journal (https://doi.org/10.1002/vzj2.20251), the researchers recently reported that the topsoil dried out significantly from summer to autumn down to a depth of about 3 m, as reflected in the increased resistivity values. Below that depth, a decrease in resistivity in winter signaled an increase in soil water content.
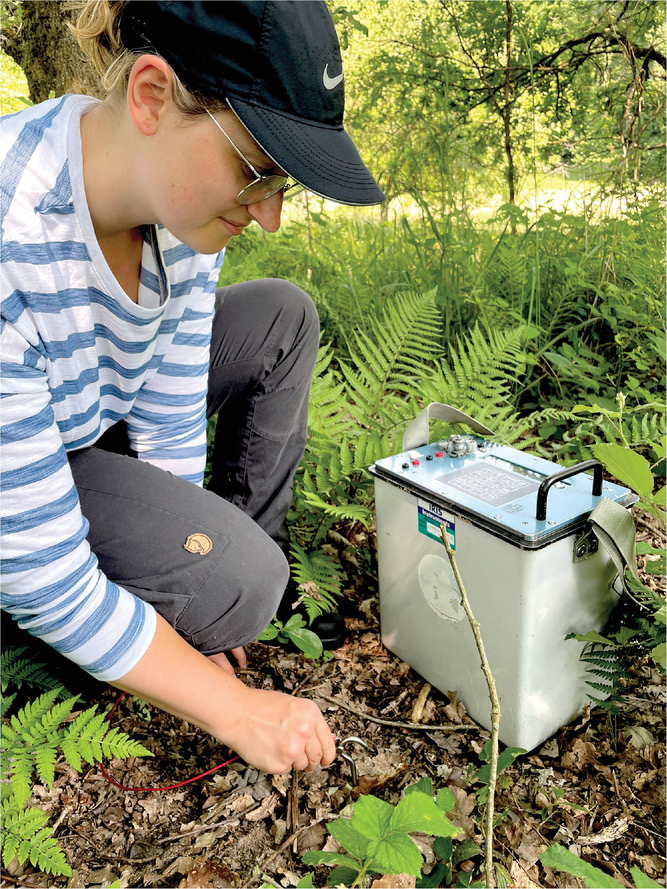
The researchers also observed anomalies in the data, which through terrestrial laser scans, they correlated to individual trees in the study plot. They found, for example, a significant relationship between lower resistivity in the top meter of soil and larger tree root areas and crown projections. First author Julia Rieder prepares an electrical resistivity tomography (ERT) measurement in a forest in Bavaria, Germany.
They also found that the mean resistivity below pine was lower than below beech, which could be related to their differing root shapes.
“I hope our study helps to better understand a small part of the complex interactions in forest ecosystems,” says Rieder, a Ph.D. student in physical geography, “especially where the trees get their water from and how the soil moisture changes throughout the year and in periods of droughts.”
Under Kneisel, the University of Würzburg’s climatology working group is continuing the research in this area, using 2D ERT with less spacing between electrodes as well as pairing 3D ERT with electromagnetic induction and ground‐penetrating radar to better map root zones.
DIG DEEPER
Read the original CSA News article “New Technique Proves Effective for Landslide Early Warning,” here: https://doi.org/10.1002/csan.20809
Read the recent (March 2023) article on ERT from Vadose Zone Journal, “Monitoring Spatiotemporal Soil Moisture Variability in the Unsaturated Zone of a Mixed Forest Using Electrical Resistivity Tomography,” here: https://doi.org/10.1002/vzj2.20251
Read the earlier (June 2022) article on ERT from Vadose Zone Journal, “Monitoring Critically Saturated Conditions for Shallow Landslide Occurrence Using Electrical Resistivity Tomography,” here: https://doi.org/10.1002/vzj2.20204
Text © . The authors. CC BY-NC-ND 4.0. Except where otherwise noted, images are subject to copyright. Any reuse without express permission from the copyright owner is prohibited.


