Drone Imagery Provides Valuable Insight on In-Season Cover Crop Growth


Cover crop management depends on building and estimating biomass amounts, which can vary across field and management settings. This study used multi-flight drone imagery and the normalized difference vegetation index (NDVI) to map cover crop growth over three different winter seasons and compare it with spring biomass accumulation. Drone imagery can be used to enhance our understanding of winter crop growth, providing additional data to explain the resulting biomass across variable conditions. Earn 0.5 CEUs in Crop Management by reading this article and taking the quiz at https://web.sciencesocieties.org/Learning-Center/Courses.
Cover crop management is often focused on increasing biomass, which is accomplished through species selection, earlier planting, or later termination (Brennan & Boyd, 2012; Poffenbarger et al., 2015; Finney et al., 2016; Pantoja et al., 2016). Biomass production can also vary based on factors such as accumulated growing degree days (GDD), fall soil nitrate, or spring rainfall (Prabhakara et al., 2015; Baraibar et al., 2020; Otte et al., 2019; Jennewein et al., 2022).
Of great interest to both farmers and researchers is the ability to estimate biomass without having to take a large number of physical samples. Proximal- and remote-sensing methods (e.g. satellite or drone imagery) have been used to make estimates of cover crop
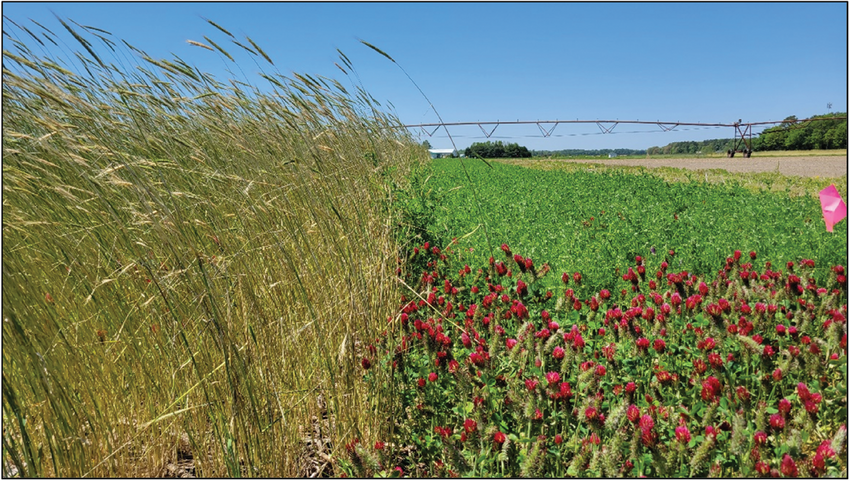
biomass with the interest of reduced physical sampling (Prabhakara et a., 2015; White et al., 2019; Corti et al., 2022). Multispectral images from satellites are often freely available, for example, the USGS Landsat 7 satellite orbited the Earth at 705 km, providing multispectral images with 30-m resolution for any given location every 16 days (USGS, 2023). Additionally, drones, or uncrewed aerial vehicles (UAVs), have been used successfully to collect multispectral images of agronomic and cover crops (Corti et al., 2022; Meresma et al., 2020; Gao & Zhang, 2021). Although satellite imagery may be freely available, drones provide higher-resolution images than satellites and can be flown on demand, allowing for more frequent measurements over the growing season. For this study, we collected multispectral imagery using a drone to examine seasonal growth patterns of winter cover crops (single species and mixtures) across three winter growing seasons in southern Delaware, USA.
Methods and Experiment Setup
Adjacent cover crop trials were established in the 2018–2019, 2019–2020, and 2020–2021 winter growing seasons (herein referred to as 2018, 2019, and 2020 seasons) in a Pepperbox sandy loam (Loamy, mixed, semiactive, mesic Aquic Arenic Paleudults). Briefly, we planted cereal rye, a rye and crimson clover mix, and a rye and hairy vetch mix; a no- cover control was included. Plots were planted in a randomized complete block design. The seeding rate for rye was 100 lb/ac; mixtures were seeded at 40 and 20 lb/ac for the rye and legume, respectively. Prior to termination, cover crop biomass was collected from each plot, dried, and weighed. Rainfall and daily minimum and maximum air temperatures were collected on-site by the Delaware Environmental Observing System (DEOS, 2023). Growing degree days for cover crops were calculated using the following equation:
GDD = [(Tmax + Tmin )/2] – Tbase ,
where Tmax is the maximum daily temperature, Tmin the minimum daily temperature, and Tbase is the base temperature of 32°F.
The multispectral cameras mounted on the drones have several lenses with filters to select for specific wavelengths, such as red, green, or near-infrared (NIR) light. A total of 13, 9, and 16 flights were performed in 2018, 2019, and 2020, respectively. A reflectance panel was used to correct for lighting conditions, and ground control points were used correct for georeferencing errors. Imagery from the flights were stitched into orthomosaics using Pix4D Mapper software (Figure 2).
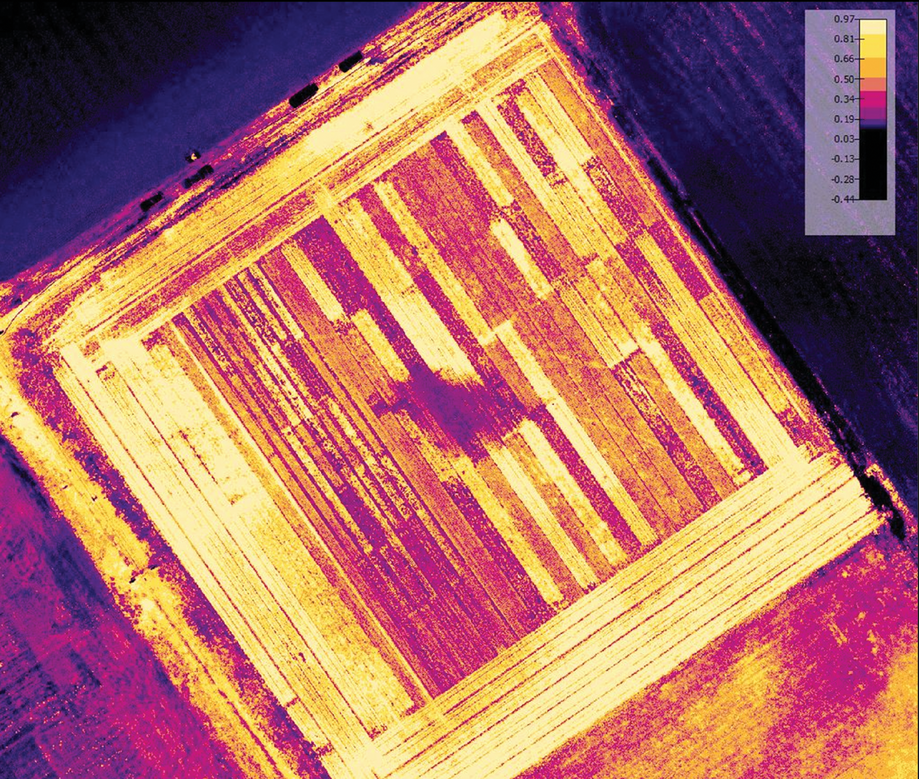
This software used imagery from the red and NIR wavelengths to calculate the normalized difference vegetation index (NDVI), which is well known for its ability to estimate plant biomass or “greenness.” The NDVI is constrained between the values of –1.0 to 1.0, using the following calculation:
NDVI = NIR − Red / NIR + Red
Growing Season Trends Between NDVI and Cover Crops
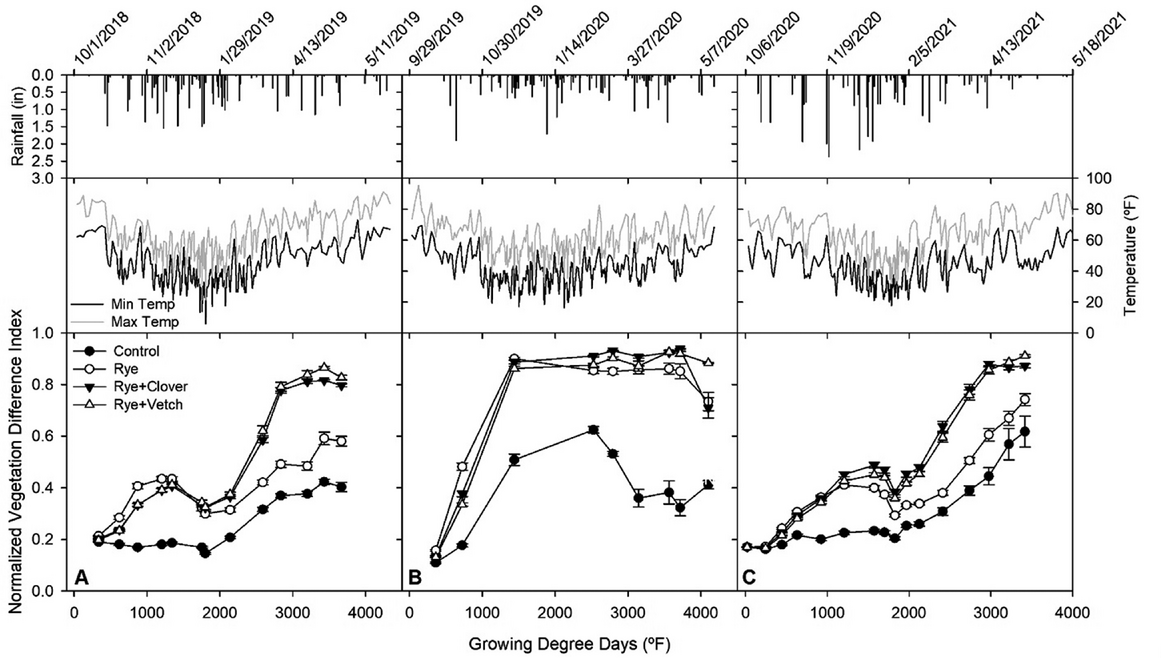
Periodic NDVI measurements throughout the three winter growing seasons revealed several interesting trends that were likely related to physiological differences between crop species or to variations in seasonal weather patterns (Figure 3). In Figure 3, NDVI values of approximately 0.20 indicate bare soil with soil cover by vegetation reaching maximums around a NDVI of 0.90.
Based on a repeated measures analysis, NDVI patterns were similar across species and GDDs for the 2018 and 2020 growing seasons. The monoculture rye plots had significantly higher NDVI between 300 to 400 GDD than the rye + legume mixes. This could be related to the higher seeding rates for the monoculture rye (100 lb rye/ac) compared with the rye seeding rate in the legume mixes (40 lb rye/ac). Since we did not include monoculture clover or vetch plots, we cannot say with certainty that the rye seeding rate was the main cause of the differences in early fall NDVI. However, Boyd et al. (2009) reported significantly more early fall coverage for cereal rye in one of two seasons when seeding rates were increased from 80 to 160 lb/ac. Miller and Adkins (2021) also measured greater NDVI with higher seeding rates of winter wheat throughout the growing season.
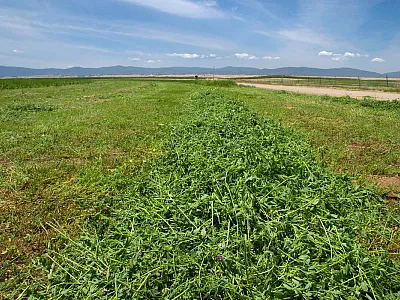
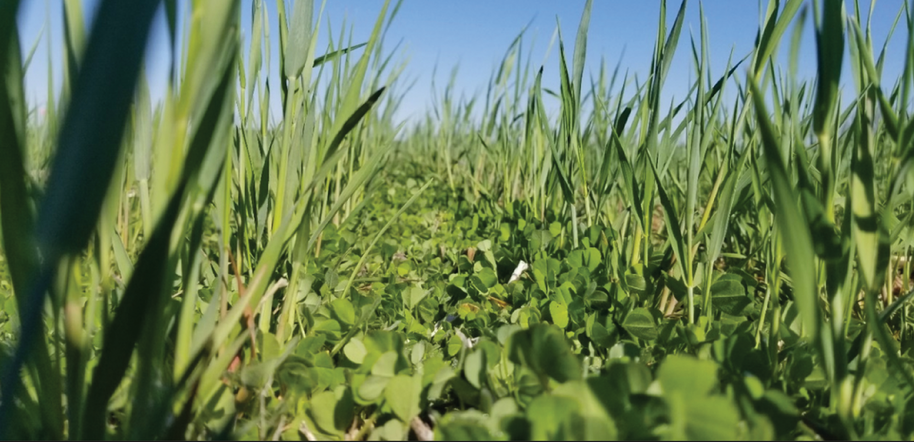
At some point between 600 and 1500 GDD, the NDVI of plots planted with the rye + legume mixes caught up with the rye monoculture plots. Past this point (>1500 GDD or February/March), the NDVI of mixes exceeded that of the monoculture rye plots, which is probably best explained by the more prostrate growth of the legumes (Figure 4), which produces greater ground cover. By the end of the cover crop seasons in 2018 and 2020, NDVI could be at least 0.20 higher in in plots that included legumes (Figure 3A,C).
At some point between 600 and 1500 GDD, the NDVI of plots planted with the rye + legume mixes caught up with the rye monoculture plots. Past this point (>1500 GDD or February/March), the NDVI of mixes exceeded that of the monoculture rye plots, which is probably best explained by the more prostrate growth of the legumes (Figure 4), which produces greater ground cover. By the end of the cover crop seasons in 2018 and 2020, NDVI could be at least 0.20 higher in in plots that included legumes (Figure 3A,C).
Besides cumulative growth due to warmer temperatures, winter weather conditions could also be observed through NDVI. In southern Delaware, NDVI increases were slower between 1400 and 2160 GDD as minimum temperatures approached 32°F (Figure 3). Interestingly, we noted a drop in NDVI that occurred at approximately 1800 GDD (early February) during the 2018 and 2020 winter seasons, which was likely related to killing frosts when temperatures dropped below 23°F in all cover crop plots. As such, drone NDVI measurements were able to identify annual freeze events, which can damage crop tissues (e.g., cause yellowing of leaves) and reduce growth (Prabhakara et al., 2015). The extent of plant tissue damaging during frosts is not well predicted by winter GDD, which only tracks growth. Yet, winter weather patterns that result in freeze damage of leaf tissues will have necrotic biomass remaining, which may be collected but is not accurately measured by NDVI (Prabhakara et al., 2015).
During the 2019 season, cover crops accumulated 1800 GDD 14 days ahead of both 2018 and 2020. Based on Figure 3, fall cover crop growth appeared to occur more rapidly as NDVI values were above 0.8 before 1800 GDD, double the NDVI at 1800 GDD for the other two seasons. Miller and Adkins (2021) also reported high NDVI (0.67 at GS24) for 2019– 2020 winter wheat in southern Delaware while NDVI recorded during previous seasons (2017–2019) were almost half the 2019 values (i.e., 0.32–0.35 at GS24). Increased fall growth likely explains greater overall biomass in the 2019 season compared with the other years, and drone imagery helps indicate when this growth may have occurred. We saw no evidence of freeze damage affecting NDVI in 2019 even though minimum daily temperatures dipped below 32°F by early February. Flights occurred less frequently during the 2019 season; as such, it seems possible that we may have missed seeing the effect of freeze events on NDVI. Despite freezing temperatures, all 2019 cover crops had similar NDVI between 1400 to 3715 GDD, at which point we observed a drop in rye NDVI as the rye crop entered the reproductive stage.
Instead of just observing cover crop NDVI at each individual time point, growth can also be estimated across the entire season. This can be done by calculating the area under the curve (AUC), which is a summation of the change in GDD multiplied by the NDVI at each time point. In this way, the early-season rye tillering (measured by NDVI) can be accounted for (Figure 5), instead of just the NDVI measured at biomass sampling. Within Figure 5, it can be observed that monoculture rye can produce biomass > 5 tons/ac, similar to when it is mixed with legumes. Despite having NDVI values at least 0.20 units lower (>2000 GDD) than the legume mixtures (Figure 3), the cumulative growth measured by AUC helps produce stronger predictions of biomass (Figure 5).
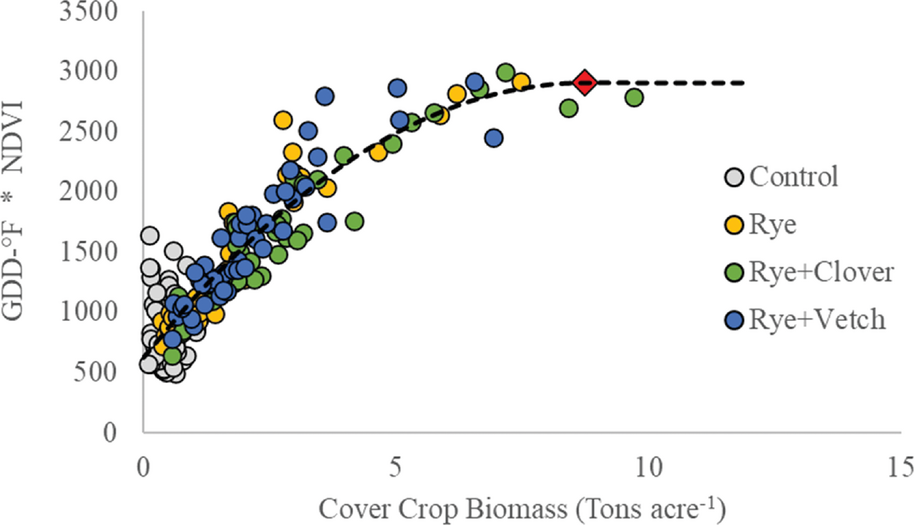
The use of AUC puts the saturation/plateau for biomass at 8.7 tons/ac, higher than those previously reported (0.7– 0.8 tons/ac) using remote sensing (Prabhakara et al., 2015; Jenneweing et al., 2022). Although multispectral drone imagery may not be practical for everyone, the increased access to satellite imagery may provide the same estimates. Imagery would just have to be collected over the growing season so that AUC could be calculated, potentially creating a map of biomass across the whole field prior to termination.
Summary
While this study was limited in scope (i.e., observation of a limited number of species/mixes in a small geographic area), the data show the promise in using drones to obtain additional data about winter cover crop growth with minimal labor. Pairing winter NDVI (or other vegetation indices) measurements with weather data may help to predict cover crop biomass and allow farmers to better manage their cover crops. In particular, multiple measurements can observe species difference in early-season growth, such as tillering in small grains, as well as mid-winter freeze damage, giving better estimates of biomass prior to termination. The combination of GDD and multiple NDVI during the season can create a cumulative basis for estimating cover crop biomass across different species.
References
Baraibar B., Murrell, E. G., Bradley, B. A., Barbercheck, M. E., Mortensen, D. A., & Kaye, J. P. (2020) Cover crop mixture expression is influenced by nitrogen availability and growing degree days. PLoS ONE, 15(7), e0235868. https://doi.org/10.1371/journal.pone.0235868
Brennan, E. B., & Boyd, N. S. (2012). Winter cover crop seeding rate and variety affects during eight years of organic vegetables: I. Cover crop biomass production. Agronomy Journal, 104(3), 684-698. https://doi.org/10.2134/agronj2011.0330
Corti, M., Cavalli, D., Cabassi, G., Bechini, L., Pricca, N., Paolo, D., ... & Marino Gallina, P. (2023). Improved estimation of herbaceous crop aboveground biomass using UAV-derived crop height combined with vegetation indices. Precision Agriculture, 24(2), 587–606. https://doi.org/10.1007/s11119-022-09960-w
DEOS. (2023). Delaware Environmental Observing System: Ag weather summary. http://www.deos.udel.edu/data/agirrigation_retrieval.php
Finney, D. M., White, C. M., & Kaye, J. P. (2016). Biomass production and carbon/nitrogen ratio influence ecosystem services from cover crop mixtures. Agronomy Journal, 108(1), 39– 52. https://doi.org/10.2134/agronj15.0182
Gao, F., & Zhang, X. (2021). Mapping crop phenology in near real-time using satellite remote sensing: challenges and opportunities. Journal of Remote Sensing, 2021, 8379391. https://doi.org/10.34133/2021/8379391
Jennewein J.S., Lamb B.T., Hively, W.D., Thieme, A., Thapa, R., Goldsmith, A., & Mirsky, S.B. (2022) Integration of satellite based optical and synthetic aperture radar imagery to estimate winter cover crop performance in cereal grasses. Remote Sensing, 14(9), 2077. https://doi.org/10.3390/rs14092077
Maresma, A., Chamberlain, L., Tagarakis, A., Kharel, T., Godwin, G., Czymmek, K. J., ... & Ketterings, Q.M. (2020). Accuracy of NDVI-derived corn yield predictions is impacted by time of sensing. Computers and Electronics in Agriculture, 169, 105236. https://doi.org/10.1016/j.compag.2020.105236
Miller, J. O., & Adkins, J. (2021). Monitoring winter wheat growth at different heights using aerial imagery. Agronomy Journal, 113(2), 1586–1595. https://doi.org/10.1002/agj2.20539
Otte, B., Mirsky, S., Schomberg, H., Davis, B., & Tully, K. (2019). Effect of cover crop termination timing on pools and fluxes of inorganic nitrogen in no‐till corn. Agronomy Journal, 111(6), 2832–2842. https://doi.org/10.2134/agronj2018.10.0699
Pantoja, J.L., Woli, K.P., Sawyer, J.E., & Barker, D.W. (2016). Winter rye cover crop biomass production, degradation, and nitrogen recycling. Agronomy Journal, 108(2), 841–853. https://doi.org/10.2134/agronj2015.0336
Poffenbarger, H.J., Mirsky, S.B., Weil, R.R., Maul, J.E., Kramer, M., Spargo, J.T., & Cavigelli, M.A. (2015). Biomass and nitrogen content of hairy vetch–cereal rye cover crop mixtures as influenced by species proportions. Agronomy Journal, 107(6), 2069–2082. https://doi.org/10.2134/agronj14.0462
Prabhakara, K., Hively, W.D., & McCarty, G.W. (2015). Evaluating the relationship between biomass, percent groundcover and remote sensing indices across six winter cover crop fields in Maryland, United States. International Journal of Applied Earth Observation and Geoinformation, 39, 88–102. https://doi.org/10.1016/j.jag.2015.03.002
USGS. (2023). Landsat 7: Landsat Missions. https://www.usgs.gov/landsat-missions/landsat-7
White, C.M., Bradley, B., Finney, D.M., & Kaye, J.P. (2019). Predicting cover crop nitrogen content with a handheld normalized difference vegetation index meter. Agricultural & Environmental Letters, 4(1), 190031. https://doi.org/10.2134/ael2019.08.0031
Self-Study CEU Quiz
Earn 0.5 CEUs in Crop Management by taking the quiz for the article at https://web.sciencesocieties.org/Learning-Center/Courses. For your convenience, the quiz is printed below. The CEU can be purchased individually, or you can access as part of your Online Classroom Subscription.
- An example of remote sensing of cover crops would include
- hand-harvested samples.
- accessing satellite imagery.
- use of a chlorophyll meter.
- recording planting date.
- A commonly used vegetation index for estimating plant growth or biomass is the
- normalized derivative vegetation index.
- naturalized difference vegetation index.
- normalized difference vegetation index.
- naturalized determinant vegetation index.
- Compared with other cover crops measured in this study, when did the monoculture rye plots have higher NDVI?
- Early in the cover crop growth season (October to December).
- During the entire cover crop growth season (October to May).
- During the winter period of cover crop growth (December to March).
- During the spring period of cover crop growth (March to May).
- A drop in NDVI during what period may have indicated freeze damage to cover crops?
- Early March.
- Early January.
- Early December.
- Early February.
- Instead of measuring NDVI at harvest, what can we calculate from several flights over the season to estimate biomass?
- Area under the curve.
- Drone height above ground.
- Field acreage.
- Absolute crop coverage.
Text © . The authors. CC BY-NC-ND 4.0. Except where otherwise noted, images are subject to copyright. Any reuse without express permission from the copyright owner is prohibited.


