Soil pH and Nutrients: Everything Is Local


Developed more than 80 years ago, the soil pH and nutrient diagram offers a quick reference that growers can use to gauge soil fertility and plant nutrition. At first glance, the relationship between soil pH and nutrient availability makes sense. Soil pH influences the solubility, concentration, ionic form, adsorption, and mobility of important plant nutrients. But this simple diagram hides the complexity of this relationship. Earn 0.5 CEUs in Nutrient Management by reading this article and taking the quiz at https://web.sciencesocieties.org/Learning-Center/Courses.
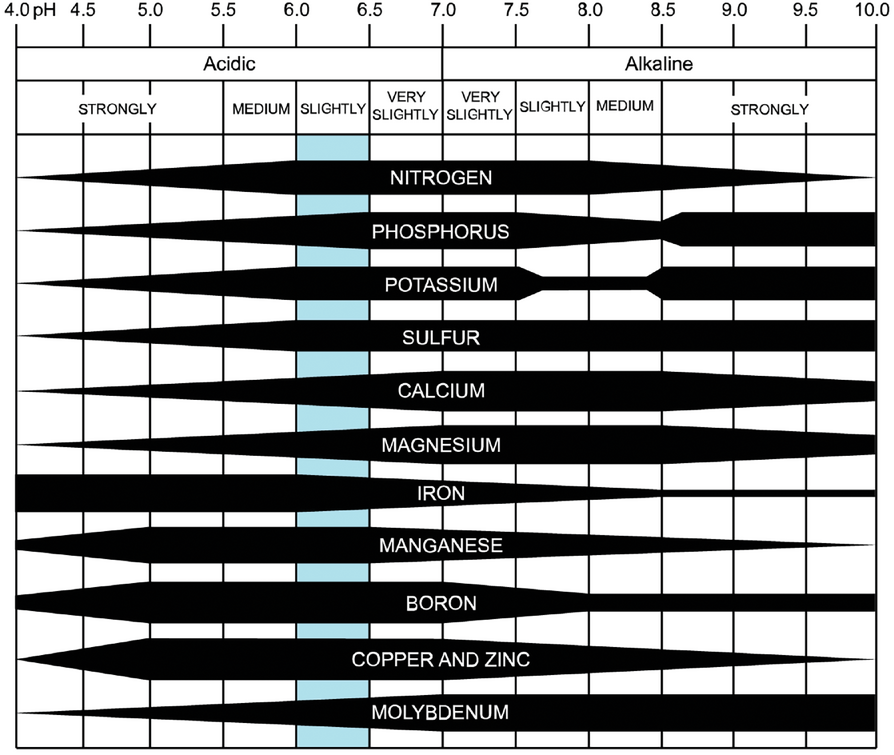
Developed more than 80 years ago, the soil pH and nutrient diagram encapsulates some of the fundamental concepts of agriculture. The diagram, which has been has been widely reprinted in many different mediums, offers a quick reference that growers can use to gauge soil fertility and plant nutrition.
At first glance, the relationship between soil pH and nutrient availability makes sense. Soil pH influences the solubility, concentration, ionic form, adsorption, and mobility of important plant nutrients. But this simple diagram hides the complexity of this relationship.
“[Soil] pH in relation to nutrient availability is like temperature in humans."
“[Soil] pH in relation to nutrient availability is like temperature in humans."
“[Soil] pH in relation to nutrient availability is like temperature in humans,” says Antonio Mallarino, CPSS and professor of soil fertility and nutrient management at Iowa State University. “Too high or too low pH is an indication that maybe something . . . may be wrong but it does not tell you what is wrong or how to fix it.”
Limitations of the Diagram
The soil pH diagram details the availability of 11 nutrients across a spectrum of soil pH values. The width of a nutrient band at any pH indicates the relative availability to a plant. According to the diagram, the ideal soil pH for nutrient availability is around 6.5.
Despite its universal acceptance, the diagram has limitations. Data sharing is a critical component of research today, but the 1947 paper from the Soil Science Society of America Journal (https://bit.ly/3uvLZ5p) that presented the diagram to the larger agricultural community provides no data or references. The paper also explains that the graph was designed for well-drained soils in humid regions. This relationship does not hold for other soil regimes or climate regions. The paper also does not address other factors that could affect nutrient availability outside of soil pH.
“The basic assumptions [behind the diagram] are ‘directionally correct’ as a general guide, but there are many factors that determine the plant availability of nutrients,” Mallarino explains. “People should be careful [when] extrapolating numbers in the diagram and recognize the limitation of assuming nutrient availability using soil pH alone.”
Digging into Soil Complexity
Eight decades later, Hartemink and Barrow revisited this universally accepted concept in a 2023 paper published in journal Plant and Soil (https://bit.ly/48jp9vE).
Their work expands on the limitations of the diagram and opens new opportunities to explore this topic with growers. To begin, soil pH is a bit of a misnomer. The term pH applies to liquids, so soil pH is really addressing the pH of the pore water between grains of sediment. Other factors that affect nutrient availability that are not addressed in the diagram include parent rock, soil mineralogy, and regional climate.

Parent Rock and Soil Minerology
Parent rock is the starting material in the production of sediment grains that make up one component of soil. The parent rock can be sedimentary, metamorphic, or igneous and is composed of a variety of different minerals. The composition of minerals in the parent rock determines the nutrient profile of the soil. Ongoing physical and chemical weathering continue to break down the minerals to replenish nutrients to the soil.
Soils composed of small sediment particles, like silt and clay, tend to stick to organic matter, buffering the pore water and diminishing shifts in pH. Conversely, water flows more easily through sandy soils, allowing the organic compounds to pass quickly. As a result, sandy soils lack the same buffering capacity and are more susceptible to acidification.
Climate
Climate is dictated by temperature and precipitation, which vary regionally. Both factors control the degree of physical and chemical weathering through wind and water erosion. Chemical weathering is enforced by the acidity of rainwater, which is influenced by the carbon dioxide concentration in the atmosphere. As a result, the slightly acidic rain water affects how ions are leached from the minerals in the soil and parent rock. Warm, humid environments receive more rainfall and tend to produce acidic soil. Dry environments receive less rainfall and tend to produce neutral or alkaline soil.
The Path Forward
Rather than rely on a simple diagram that was designed for one specific type of soil and climate region, a better approach may come from focusing on local conditions.
When assessing soil nutrients, it is important to understand the local geology and climate to know how soils should behave. According to Mallarino, agronomists need to refocus the discussion from the diagram when deciding when and how to lime acidic soils to correct for nutrient deficiency. For example, extreme soil alkalinity due to sodium or calcium carbonate may induce deficiency of a few nutrients. Correcting this problem is complex and expensive. Most states have developed useful practices to address these needs.
“Soil pH and micronutrient availability vary greatly by region, so look at local research and suggestions to make appropriate local decisions,” Mallarino advises. “But we always need demonstrations in order to educate and decipher how regional variations affect crops.”
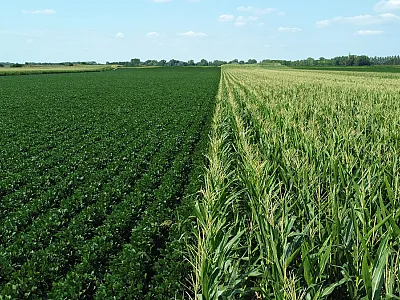
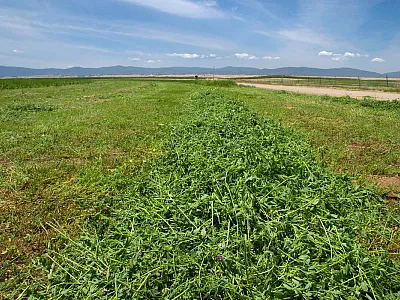
According to Tom Bruulsema, chief scientist at the International Plant Nutrition Institute Canada, it is also important to pay attention to how specific crops respond to nutrients shifts with soil pH. Major crops, like corn and soybeans, are not particularly finicky, but some crops, like alfalfa and red clover, are more susceptible to soil acidification.
Beyond nutrients and soil pH, Bruulsema also advocates that agronomists focus on soil health. The Soil Health Institute encourages producers to increase soil organic carbon to improve the productivity and health of the soil. This approach has also been shown to be an effective way to mitigate climate change because soil can hold more carbon than either atmosphere or terrestrial vegetation alone. By advocating for soil organic carbon, producers can work toward protecting soil health and ensuring long-term agricultural production.
Today, agriculture is also leaning into advances with machine learning. Scientists can create mathematical algorithms that can crawl through the datasets from past and present research to identify unseen relationships among nutrients, soil type, soil pH, and crops. With these new insights, it may be possible to establish long-term demonstration plots to explore the relationships in crop productivity and soil health.
“The take-home message of the chart is that it is ok for a simple introduction,” Bruulsema says. “It is important to pay attention to crops and to understand local micronutrient deficiencies to ensure producers can treat their fields effectively and bring in a productive yield.”
Self-Study CEU Quiz
Earn 0.5 CEUs in Nutrient Management by taking the quiz for the article at https://web.sciencesocieties.org/Learning-Center/Courses. For your convenience, the quiz is printed below. The CEU can be purchased individually, or you can access as part of your Online Classroom Subscription.
- In the soil pH diagram, the width of each band indicates
- the actual amount of each nutrient available in soil with that pH.
- the relative availability of a nutrient at that pH.
- whether or not a nutrient will be present in soil at that pH.
- if a soil is alkaline or acidic.
- The soil pH diagram was designed for
- wet soils in humid regions.
- all soils in all regions.
- well-drained soils in humid regions.
- soils in dry regions.
- The term “soil pH” actually refers to the pH of the pore water between the sediment grains.
- True.
- False.
- Soils composed of small sediment particles like silt and clay
- tend to stick to organic matter.
- allow water to flow more easily.
- low organic matter to pass through quickly.
- are more susceptible to acidification.
- Which crop is more susceptible to soil acidification?
- Corn.
- Alfalfa.
- Soybeans.
- None of the above.
Text © . The authors. CC BY-NC-ND 4.0. Except where otherwise noted, images are subject to copyright. Any reuse without express permission from the copyright owner is prohibited.


