Supporting Management Decisions in Forage Production with Soil Health Measurements and Assessment

This is the second article in our series on soil health and greenhouse gas emissions on U.S. dairies associated with crop production. This article will focus on the first objective of the Dairy Soil and Water Regeneration (DSWR) project, which is to benchmark soil health and soil carbon stocks in dairy forage production systems. Earn 1 CEU in Sustainability by reading this article and taking the quiz at https://web.sciencesocieties.org/Learning-Center/Courses.
The Dairy Soil and Water Regeneration (DSWR) project addresses how adoption of soil health practices and novel manure products may increase soil carbon, reduce greenhouse gas emissions, improve water quality, increase water use efficiency, and maintain high‐yielding, high quality forage crops in major dairy regions of the United States. This multi‐year, collaborative project has three main objectives:
- sample soils from commercial production fields that receive manure and grow dairy feed to benchmark soil health and soil carbon stocks;
- quantify how the adoption of soil health practices and novel manure products affect soil health, soil carbon, water quality, water use efficiency, greenhouse gas emissions, and forage yield and quality; and
- use the data collected to inform ecosystem service models and support revenue‐generating projects and markets.
This project is a partnership among the Innovation Center for U.S. Dairy, the Soil Health Institute (SHI), Cornell University, Texas A&M AgriLife, the University of California–Davis, the University of California–Agriculture and Natural Resources, the University of Wisconsin–Madison, the University of Wisconsin–Platteville, the University of Vermont, and USDA‐ARS in Kimberly, ID.
In this article, we focus on the first objective, which is to benchmark soil health and soil carbon stocks in dairy forage production systems.
The Value of Soil Health Benchmarks for Stakeholders
⇒Dairy farmers can use the data to inform how they manage their dairy feed production fields to increase soil health and carbon stocks.
⇒Agricultural service providers can use the information to support their recommendations to farmers.
⇒Industry professionals can use the data to quantify and account for progress toward sustainability commitments such as investments in carbon sequestration and ecosystem services.
Measuring Soil Health and Soil Organic Carbon
Soil health is defined by USDA‐NRCS as “the continued capacity of soil to function as a vital living ecosystem that sustains plants, animals, and humans.” Soil health is often assessed by measuring properties indicative of a soil’s capacity to function. The Soil Health Institute has identified a minimum suite of indicators to quantify soil health in the top 6 inches of soil (Bagnall et al., 2023):
- Soil organic carbon concentration relates to the soil’s ability to cycle and retain nutrients, store water, and provide structure that supports other soil functions.
- Carbon mineralization potential quantifies the capacity to cycle carbon and nutrients by the soil microbial community.
- Aggregate stability indicates the capacity of soil to resist wind and water erosion, allow for water infiltration and storage, and provide a stable structure to support other soil functions.
- Available water‐holding capacity (AWHC) estimates the amount of water the soil can store and provide to plants.
The first three indicators require direct measurement while AWHC can be estimated with a predictive equation using soil texture and soil organic carbon (see Resources for a link to the calculator). In this project, we are measuring AWHC to verify that the predictive equation applies to heavily manured systems.
Quantifying soil carbon stocks has been receiving interest because the sequestration of soil organic carbon in cropland soils presents a significant opportunity to mitigate climate change. While the laboratory analysis of carbon concentration is the same for soil health and soil carbon stocks, typically soil carbon stock estimates require carbon concentration measurements to a depth of 12 inches (rather than 6 inches for soil health alone) as well as measurement of bulk density to quantify the carbon stock per acre.
Soil pH and electrical conductivity were quantified to provide the appropriate context to interpret soil health and soil carbon stock measurements from heavily manured systems. Soil texture was also measured to ensure that data from similar soil types were being compared.
Importance of Soil Health and Soil Carbon for Dairy Farmers
Improving soil function through the adoption of soil health practices has the potential to support biomass production; store, filter, and transform nutrients and water; host biodiversity; improve grower profitability and resilience; and regulate carbon pools. Some of the challenges faced by dairy farmers, such as compaction from heavy machinery, the need to consistently grow enough feed, and maximizing the nutrient benefit from manure application, can be alleviated by improving soil health. Soil health generally increases when farmers adopt the soil health principles of (1) reducing disturbance, (2) increasing diversity, (3) protecting the soil with cover, and (4) maintaining living roots throughout the year.
The adoption of soil health principles is associated with improved soil structure, nutrient cycling, and water retention. Increasing soil organic carbon throughout the soil profile, or carbon sequestration, can be used to offset greenhouse gas emissions. Information about soil carbon accounting is discussed by Bagnall & Morgan (2022).
Inherent Properties and Management Constrain the Health of a Soil
Soil health indicators and carbon sequestration potential are constrained by soil‐inherent properties, climate, and soil management. Soil‐inherent properties such as texture, topography, depth to bedrock, and drainage vary across the landscape and are generally not influenced by management. The variability of these factors makes it difficult for farmers, advisers, and other industry professionals to understand how management affects soil health and the capacity to store carbon.
Soil Health Institute’s Approach for Assessing Soil Health at Scale
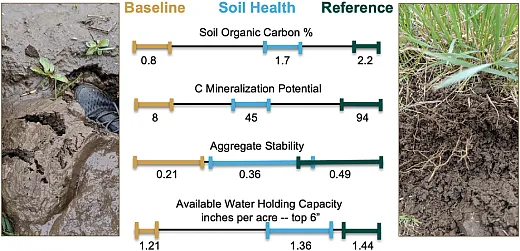
The Soil Health Institute has developed the Soil Health Benchmarks Program to support farmers’ management decisions concerning the production of food, feed, and fiber. Farmers engaged in this program are given the measured values of soil health indicators from their fields and the aggregated soil health indicator values across managements from similar soils (see Figure 1).
The process for setting soil health benchmarks includes:
- Identifying the areas of interest to sample,
- Selecting management systems,
- Engaging farmer participants,
- Collecting and analyzing soils for soil health indicators and soil organic carbon stocks,
- Interpreting measurements, and
- Sharing results.
The following sections provide an overview of how each of these steps was implemented.
Identifying the Areas of Interest to Sample
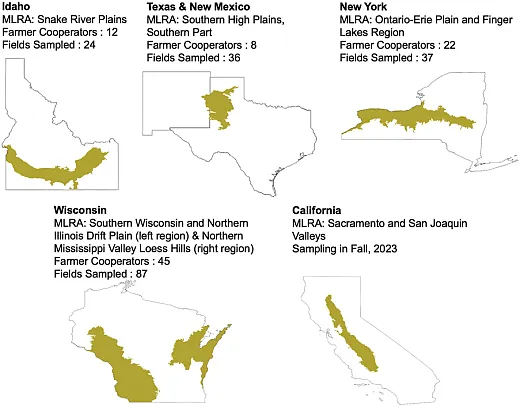
Selection of areas to sample for this project was based on several factors, including concentration of dairy operations, climate, geology, and soil‐inherent properties like texture and drainage. Five states were selected based on their contribution to annual milk production in the U.S.: California, Idaho, New York, Texas, and Wisconsin. Within these states, differences in climate, geology, and landscape position that can influence soil health potential were accounted for by focusing on one of the NRCS Major Land Resource Area (MLRAs) in each state, except for Wisconsin, where two MLRAs were selected due to contrasting geology across the major milk‐producing area. The Soil Health Institute used the NRCS soil map to identify common soils found on dairy feed operations within each MLRA and selected a maximum of two common soil types that differed by texture or drainage class to sample.
Selecting Management Systems
The Soil Health Benchmarks program for the DSWR project was designed to compare dairy feed operations that differ in the degree of physical soil disturbance and the length of time of living roots. Similar soils of a small geographic region were selected to reduce variability in soil type and climate. Dairy feed operations were categorized into the following three management systems.
⇒Baseline Management System (“Baseline”) is defined as a management system that is common for a particular region, state, or another constrained geographic area. This management system may include some of the soil health principles but would not include all of them.
⇒Soil Health Management System (“Soil Health”) is defined as a management system that reflects all or some aspects of the soil health principles. Soil Health systems would have implemented one or more soil health principles compared with the Baseline system.
⇒Reference Management System (“Reference”) is defined as a system that represents the local potential expression of soil health and is characterized by continuous living roots and lack of physical disturbance. In regions where cropland is irrigated, and/or manured, References will be irrigated and/or manured as well, representing the maximum potential expression of soil health under irrigation.
The practices available to sample in each region were grouped into these broad management systems (Table 1). In most regions, Soil Health systems included reduced tillage and cover cropping. References in the rainfed states (New York and Wisconsin) were grazed pastures where grazing is more common for dairy operations. Selecting Reference systems in semi‐arid regions was complicated by irrigation, manure additions, and the rarity of continuous perennials. Potential Reference systems that were sampled in semi‐arid regions included corners of center pivots, fourth‐year alfalfa stands under drip irrigation, and land in the Conservation Reserve Program.
Engaging Farmer Participants
Both SHI and the Innovation Center for U.S. Dairy worked collaboratively to engage local partnering research scientists, dairy cooperatives, farmer‐led watershed groups, extension agents, and NRCS personnel to reach dairy farmers in the selected regions. These local experts and co‐ops will also be engaged when data synthesis and reporting are ready to be shared with farmers and agricultural service providers.
Collecting and Analyzing Soils for Soil Health Indicators and Soil Organic Carbon Stocks
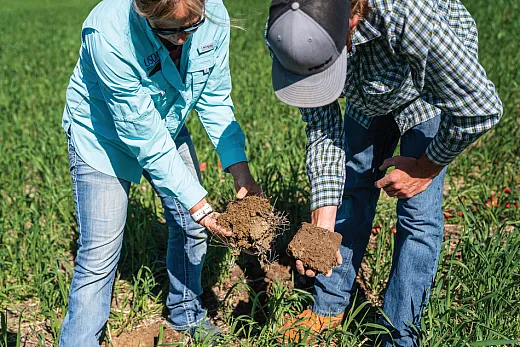
Soils were sampled approximately four weeks after planting the corn silage crop to standardize for any seasonal effects on soil health and soil carbon values. Soil health indicators and carbon were measured from composite soil samples of 0 to 6 inches (along with texture, bulk density, pH, and electrical conductivity). Another composite from 6 to12 inches was used to measure soil carbon and bulk density to calculate carbon stock from 0 to 12 inches. Available water‐holding capacity was measured from intact cores (0 to 6 inches). Aggregate stability was measured on individual aggregates collected from 0 to 3 inches. All the indicators were measured in commercial labs, and values were checked for quality assurance. Management history was compiled for each field sampled to help with data interpretation.
Interpreting Measurements
Measurements from individual fields are being aggregated into management systems based on historical management information collected. Data analysis is being performed at the MLRA level and grouped based on soil type (texture and drainage). Relative patterns are being interpreted within and across MLRA and soil types to understand differences in soil health potential and carbon storage capacity.
Sharing Benchmark Results
Results of our initial analyses of the regional aggregated data will be presented through various outlets to include the following.
- A report on soil health indicators and carbon stocks from the fields sampled will be shared with participating dairy farmers. This report will also include the aggregated data from other fields managed in the region based on the management system categories (similar to Figure 1).
- A region‐specific factsheet that shares aggregated results and main findings will also be made available on SHI’s DSWR webpage: https://soilhealthinstitute.org/our‐work/initiatives/dairy‐soil‐and‐water‐regeneration/.
- Region‐specific webinars will be used to share aggregated results, an overview of the main findings, and to provide an opportunity for questions, comments, and feedback. These webinars will be recorded and placed on SHI’s YouTube channel: https://www.youtube.com/@SoilHealthInstitute.
How Can the Soil Health Benchmarks Program Influence Decision‐Making?
The Soil Health Benchmarks program provides a farmer with the measured values of soil health indicators from the fields sampled from their farm and aggregated soil health indicator values across management systems. All farmers represented in the sampling survey will have information about the state of soil health in their field(s) and how that compares with other production fields in the region.
The intention of this program is that a farmer or grower, given this information, will be inspired to innovate and adopt management practices to improve soil health and optimize soil function to efficiently cycle water, nutrients, and carbon. Success of this program would entail farmers setting a “Goal” value for one or more soil health indicator and implementing new management practices to reach that “Goal” (see Figure 2).
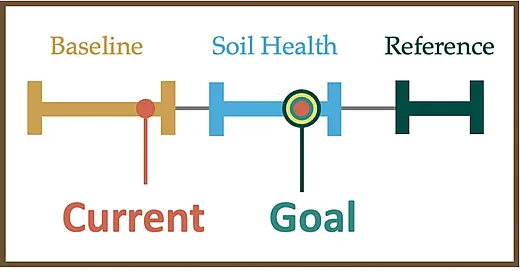
Proposed steps for setting goals and changing practices include:
- Farmer receives a report from SHI’s Soil Health Benchmarks program.
- Farmer meets with an adviser or agricultural service provider with experience with benchmarks to discuss the report.
- Farmer sets a “Goal” to increase the value of one or more indicators to improve soil health.
- Farmer identifies management practices that they can adapt to meet their Goal.
- Farmer implements selected management practices and monitors changes to the indicator selected.
Dairy Farming Included in the Soil Health Benchmarks Program
As part of the DSWR project, SHI has begun the process of benchmarking soil health and carbon stocks on dairy farms in the U.S. We have focused our sampling on six MLRAs in states that are consistently in the top 10 milk‐producing states in the U.S. To date, we have enrolled 87 dairy farmers and sampled 271 dairy feed production fields (see Figure 3).
Summary
With increasing interest in producing dairy feed while reducing environmental consequences and maintaining yields, SHI’s Soil Health Benchmarks program will deliver data to farmers that will inform them of (1) how healthy their soils are and the amount of carbon their soils are currently storing and (2) how healthy their soils can become based on management practices used by neighboring farmers in the region. Ideally, a farmer could be inspired to adopt soil health management practices to improve soil functioning for on‐farm and off‐farm benefits, such as increased soil carbon storage, reduced greenhouse gas emissions, improved water quality, and increased water use efficiency.
Funding
This project is supported by the Foundation for Food & Agriculture Research, Starbucks, Nestlé, Dairy Management Inc., and Newtrient.
References
Bagnall, D.K. & Morgan, C.L.S. (2022). Components of soil carbon accounting. Crops & Soils, 55(2), 38–43. https://doi.org/10.1002/crso.20172
Bagnall, D.K., Morgan, C.L.S., Cope, M., Bean, G.M., Cappellazzi, S., Greub, K., … & Honeycutt, C.W. (2022). Carbon‐sensitive pedotransfer functions for plant available water. Soil Science Society of America Journal, 86(3), 612–629. https://doi.org/10.1002/saj2.20395
Bagnall, D.K., Rieke, E.L., Morgan, C.L.S, Liptzin, D.L., Cappellazzi, S.B., & Honeycutt, C.W. (2023). A minimum suite of soil health indicators for North America. Soil Security, 10, 100084.
Resources
To read more about SHI’s recommended indicators, including sampling, measurement standard operating procedures, and the calculator to estimate available water‐holding capacity, visit: https://soilhealthinstitute.org/our‐work/initiatives/measurements/#overview.
To stay up to date on the Dairy Soil and Water Regeneration project, visit: https://soilhealthinstitute.org/our‐work/initiatives/dairy‐soil‐and‐water‐regeneration/.
Self-Study CEU Quiz
Earn 1 CEU in Sustainability by taking the quiz for the article at https://web.sciencesocieties.org/Learning‐Center/Courses. For your convenience, the quiz is printed below. The CEU can be purchased individually, or you can access as part of your Online Classroom Subscription.
- The Dairy Soil and Water Regeneration (DSWR) project addresses the positive impact of U.S. dairy farmers’ adoption of soil health practices and novel manure products. Which of the following is NOT listed among the numerous possible benefits of implementing these practices?
- Increased water use efficiency.
- Higher yields.
- Reduced greenhouse gas emissions.
- Improved water quality.
- Which of the following institutions is NOT involved in the DSWR project?
- Texas A&M AgriLife.
- The Land Institute.
- The University of California–Agriculture and Natural Resources.
- Cornell University.
- The Soil Health Institute has identified a minimum suite of indicators to quantify soil health in the top 6 inches of soil. How many were listed?
- one.
- two.
- three.
- four.
- What’s the difference between measuring carbon for soil health and measuring it for soil carbon stocks?
- Soil carbon stock estimates require bulk density measurements.
- For soil health, carbon concentration must be measured to a depth of 6 inches; for soil carbon stock estimates, to a depth of 12 inches.
- Both A and B.
- The procedures are the same.
- Farmers can boost soil health by following four key principles. Which of the following is NOT among them?
- Stop pesticide use.
- Maintain living roots yearlong.
- Increase diversity.
- Protect soil with cover.
- The Soil Health Institute developed the Soil Health Benchmarks program working with dairy farmers from which of the following states?
- California, Idaho, Michigan, New York, and Wisconsin.
- California, Idaho, Michigan, Pennsylvania, and Wisconsin.
- California, Idaho, New York, Texas, and Wisconsin.
- California, Idaho, New York, Pennsylvania, and Texas.
- When does soil sampling of farmers’ corn silage crop fields take place for the Benchmarks program?
- Two weeks after planting.
- Four weeks after planting.
- Just before harvest.
- At tasseling.
- Farmers participating in the Benchmarks program will receive information about soil health in their own field as well as how their fields compare with other production fields in their region.
- True.
- False.
- The Benchmarks program hopes to use data to incentivize farmers to improve their soil health with the end goal of getting the farmer to
- consult with an adviser on how to improve soil health.
- commit to management practices to improve soil health.
- implement a selected management practice that meets a specified goal and to monitor progress toward that goal.
- convert to organic farming.
- How many dairy feed production fields have been sampled to date for the Benchmarks program?
- 56.
- 87.
- 110.
- 271.
Text © . The authors. CC BY-NC-ND 4.0. Except where otherwise noted, images are subject to copyright. Any reuse without express permission from the copyright owner is prohibited.


