Measuring Greenhouse Gases in Dairy Soils: Innovative Technologies to Advance In-the-Field Research
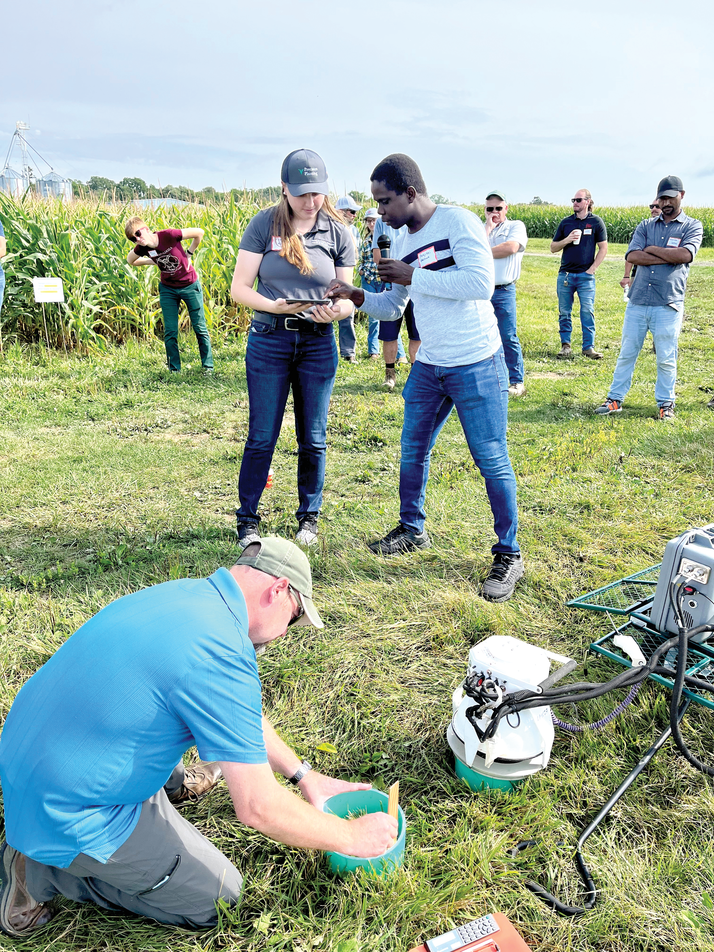

This is the third article in our series on soil health and greenhouse gas emissions on U.S. dairies associated with crop production. This article will focus on innovative technologies to advance in-the-field research. Earn 1 CEU in Sustainability by reading this article and taking the quiz.
Adolfo Coyotl, a graduate student researcher on the Dairy Soil and Water Regeneration (DSWR) project at the University of California–Davis, had experience measuring greenhouse gas (GHG) emissions from the soil before starting work on the DSWR project.
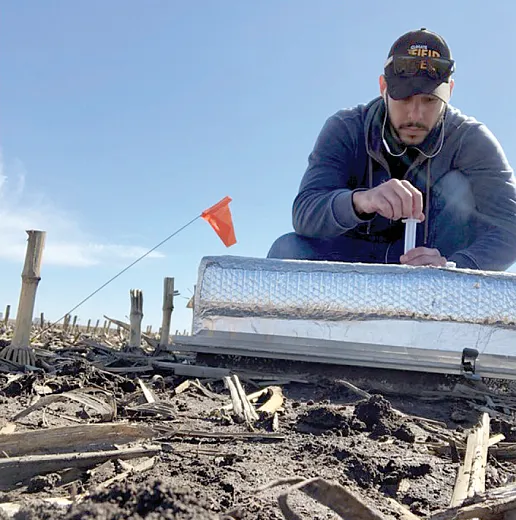
He’d been on teams that characterized the GHG response to various management practices like flooding vineyards and applying green compost in tomato fields. His work to measure the GHG fluxes was done using a static chamber method, trapping gases within a chamber and using a syringe to draw out samples at regular intervals for analysis in a lab.
Hitting those intervals, at necessary equal distances, kept him on his toes—literally.
“In a field site where you have various collars installed, you need to make sure you return to the first one for sampling at the time you had planned, so you have to run through the field and then run all the way back to make sure you aren’t missing the intervals,” Coyotl explains.
Researchers working on the DSWR project are using a dynamic chamber method instead, and the difference is stark.
“Now, the collars are pre‐installed, and I go out to the field, measure for about two minutes, and I’m done for that measurement point. It’s a huge, huge difference,” Coyotl says of his work in an almond orchard in Escalon, CA where he is focusing on the interaction between dairy compost‐amended tree rows with synthetic fertilizer.
Not only is the national‐scale DSWR project breaking new ground by pursuing measurement‐based assessments of dairy’s GHG footprint for feed production, the first‐of‐its‐kind project is testing the limits of technology and pushing the science forward in a way that could enhance long‐established research models.
From the GHG instruments to technology used for measuring water infiltration to various soil sensors and data loggers, the DSWR project will have an outsized effect.
“There are so many layers to this work. The technology that we’re using to capture measurements is going to allow us to do so much more than just collect data,” says Mara Cloutier, a soil scientist and a DSWR project manager at the Soil Health Institute.
The Project
The DSWR project is a six‐year effort of the dairy community to zero in on research gaps in feed production and manure‐based fertilizers. Filling those gaps is essential to farming today and will also inform new markets, incentives, and investments in dairy sustainability. The project, now in its second year, is the most expansive and in‐depth look at the environmental footprint of feed practices on working dairy farms ever carried out in the U.S.
Using a whole‐systems approach, researchers are measuring how different management practices—from using cover crops to applying novel fertilizers, including manure‐based products—affect soil health, potentially reduce GHG emissions, and impact water quality under varying climate and field water management systems.
The work began in 2021 with a baseline survey of soil health and carbon storage on dozens of dairies representing climates and soils in four major milk production regions of the country. So far, researchers have collected 271 soil samples across 171 dairy forage fields.
Researchers now are diving more deeply to track a smaller number of farms across growing seasons and compare traditional soil health practices to advanced practices like strip‐till, no‐till, new manure products, cover crops, and planting green. Six universities are conducting research: Cornell University in New York, Texas A&M AgriLife Research, the University of California–Davis, the University of Vermont, the University of Wisconsin–Madison, and the University of Wisconsin–Platteville. The USDA‐ARS Northwest Irrigation and Soils Research site in Kimberly, ID is also conducting research.
Idaho: In the Field
Idaho’s research farm is one of six in the DSWR project where large‐plot studies are gathering much more in‐depth data. There, the team is examining the effects of innovative manure‐based products on soil health, GHG emissions, nutrient cycling, and crop yield and quality in a typical agronomic system.
This is the first time the USDA site has used a dynamic chamber system to measure GHG. The system chosen for research sites in DSWR is made by LI‐COR.
“We’ve done a lot of GHG emissions work here on the research farm, but we’ve used a combination of static chambers in the past, and we have a set of fully automated chambers that monitor emissions continuously over time. So the LI‐COR system was new to us in terms of measurement technologies. It’s been interesting to see how it operates compared with our other systems we have here,” says April Leytem, research soil scientist and principal investigator at the Idaho site.
The farm is one of the USDA‐ARS locations for GRACEnet, an acronym for Greenhouse Gas Reduction Through Agricultural Carbon Enhancement Network. The standard instrumentation for that program is based on static flux chambers, a more labor‐intensive method, Leytem says.
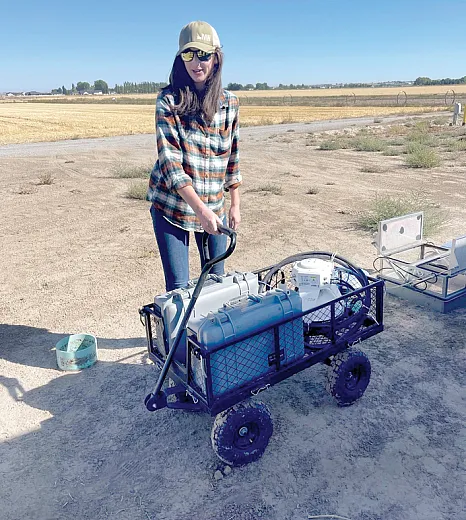
With the static chamber system, gas samples are manually collected over a period of time, and gas concentrations are measured in the laboratory with a gas chromatograph,’’ Leytem says. “Then we can calculate a flux rate based on the accumulation of gases in the chamber over time. LI‐COR is a similar technology, except it’s doing the measurements while you’re in the field. You don’t collect a gas sample and then bring it back to the lab to analyze. It’s all done right in the field.”
Dynamic vs. static refers to whether the air is circulating during the measurement. In a static chamber, the air isn’t moving inside the closed chamber. The user can either put a chemical in the chamber that absorbs the gas over a fixed time period or can collect gas samples in a syringe at multiple time points and bring the samples back to a lab to measure the concentration change over time. A dynamic system circulates the air in tubing between the instrument and the chamber and typically takes measurements much faster—once per second for two minutes vs., for example, four times over a 30‐minute period in a static system. And there’s no need for lab analysis.
LI‐COR’s unit also includes a piece of equipment called a smart chamber that makes doing calculations in the dynamic system much easier. Functioning as a lid for the chamber, it also collects the data from gas analyzers and the soil temperature and moisture probes all in one place that can feed easily into the data software.
Abigail Baxter, a research physical scientist, is managing the day‐to‐day measurements at the Idaho site. She described how the system is put to work in the field:
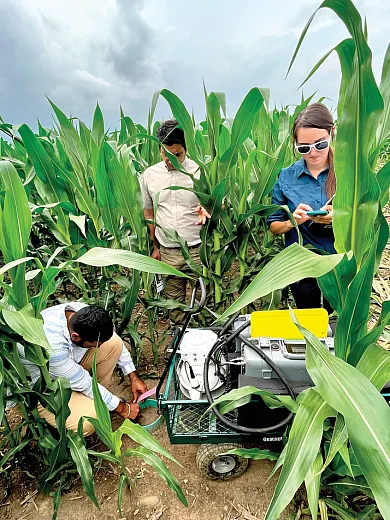
The system is connected to two trace gas analyzers—one set up to measure carbon dioxide and methane and the other, nitrous oxide. It creates an enclosed system over a small soil collar placed in the ground that allows for measuring the same area consistently over time. The gases are vented through the analyzers, which are set up using a reference laser system, technically known as cavity‐enhanced absorption spectroscopy. The lasers are set to match absorption, wavelength common for carbon dioxide (CO2), methane (CH4), and nitrogen dioxide (N20). The system then gives a concentration measurement for how much of those different molecules are in a gas sample.
Baxter is typically sampling more than once a week in the summer season and then once per week all throughout the year, obtaining monthly and annual estimates. During the past two years, they’ve had 90 days of measurements with 48 individual measurements each day, requiring about four hours a day. Two collars are located in each of 24 plots.
“We are looking at both gas fluxes from within cropping rows and between rows, seeing how root respiration may affect those fluxes,” Baxter says. “I hadn’t done a lot of greenhouse gas work before this project, so it’s been quite a learning curve. It has been very interesting to see how the system performs in the field,” she says.
California: In the Field
In California, Coyotl’s team is conducting a large‐plot study in a commercial almond orchard, focusing on the interaction between dairy compost‐amended tree rows with synthetic fertilizer.
A second study in the state, led by the University of California Agriculture and Natural Resources, is taking place on a commercial dairy farm.
The real‐time data, enabled by add‐on software called SoilFluxPro, is not only valued by researchers but ideal for demonstrations to farmers, Coyotl says.
“The grower who we work with is fascinated by the instrument. You can see exactly what’s going on when you measure. You see the curves and the gas fluxes. You can see the microbes at work,” he says.
Jasdeep Singh, a postdoctoral researcher on the DSWR project at Cornell University in New York where three studies are being conducted across two commercial dairies finds the availability of instant results is valuable.
“We can see right away in the field what numbers we are getting,” Singh says.
Data collected in the field go through quality assurance/quality control check (QAQC) by researchers and are digitally stored in an accessible way so that any newcoming researchers over the multi‐year project can get up to speed quickly.
Thousands of Measurements
The use of an instrument to measure how easily water will infiltrate the soil is also being put to the test in the DSWR project.
Researchers are using infiltrometers made by SATURO that automatically measure infiltration rates and calculate field‐saturated hydraulic conductivity on the fly. The unit requires less water by ponding water on top of the soil and using air pressure to create two different pressure heads. It uses a pump to automatically maintain the correct water levels. The unit is designed for one person to carry and set up, and it operates unattended.
Nearly 1,100 measurements have been taken by this method in the project thus far.
“Even though the SATURO unit has been around for a while, I think there are probably a lot of people who are interested to hear how well it works in our project. It’s a hard measurement to do well,” says Daniel Liptzin, a research soil scientist at the Soil Health Institute.
Data loggers are also critically important to the project as they monitor soil temperature, moisture, and oxygen as well as air temperature and precipitation.
While the LI‐COR measurements are put to use for a limited number of days a year (e.g., 40) and require someone to go into the field, the data loggers allow researchers to understand what is occurring in the soil the rest of the time and with automatic readings, Liptzin says. With an exception or two, the DSWR teams are using METER Group loggers.
Remote accessibility of the data is a definite advantage.
“I can be sitting on my computer in the Soil Health Institute offices out East and tell you what the soil temperature is at our research sites in Wisconsin or California,” Liptzin says.
As with the SATURO instruments, oxygen sensors are not new, but even after two decades, their use has been relatively limited, for example, in wetlands where oxygen levels often can shrink to zero. The DSWR project, however, is incorporating them for use in intermediate or well‐drained soils where typical changes might be 19–21% on a daily basis, Liptzin says.
“You can see the soil breathing every day where the oxygen levels are changing,” he says.
Having those sensors in the ground is helping researchers determine the occurrence of freeze–thaw events, Cloutier says. “There’s been recent literature indicating we might be missing a lot of GHG emissions from soils because we’re missing releases of GHG during freeze–thaw events. So we can time when we sample in the winter to correspond to when we see thaw in the soils based on our temperature data.”
“A lot of the instrumentation we are using, maybe it’s been around for a while, but it hasn’t seen as much use as we’ve been giving it,” Cloutier says, noting that nearly 14,000 GHG measurements have been taken with the LI‐COR units.
Putting the Technologies to the Test
Limitations to some of the technology are a reality, but DSWR’s researchers are in essence helping to field‐test instrumentation and software, which enables providers to adjust and adapt.
One improvement opportunity pointed out to LI‐COR by a DSWR researcher and others related to managing occasional invalid readings that could render the full data problematic unless the specific point was deleted. In the past, a researcher would have to dig through the raw files to find the problem. Now the company’s software makes correcting the problem possible with a few clicks. Hardware issues, too, stemming from DSWR experiences, have been raised and are being addressed in LI‐COR updates.
“One thing I don’t think we realized at the outset was that we would be helping these companies improve their instrumentation and back‐end data processing,” Cloutier says. “This is industry and the research community working together to make a more useful product.”
The DSWR project also could generate improvements beyond hardware and software.
Soil‐sampling data will help the team understand geographical transferability of existing modeling platforms that simulate soil carbon storage with changes in management on U.S. dairy farms. All data also will be used to improve model performance to estimate more accurately what will happen if a dairy starts implementing new forage management techniques.
This includes modeling that underpins the new federal climate‐smart commodities grant projects, Cloutier says. Some parts of the modeling are well tested, but large data gaps exist in other parts; for example, the effects of different manure sources.
“We’re going to have such a huge data set across the United States that incorporates soil data and GHG data and hopefully modeling associated with that too,” she says. “Our hope is we can take that information back to the developers, so they can use the feedback if they want to update their modeling.”
Self-Study CEU Quiz
Earn 1 CEU in Sustainability by taking the quiz. For your convenience, the quiz is printed below. The CEU can be purchased individually, or you can access as part of your Online Classroom Subscription.
- Which of the following is true of the static chamber method?
- Gas samples are collected manually.
- Gas concentrations are measured in the lab.
- Gas concentrations are measured with a gas chromatograph.
- All of the above.
- The Dairy Soil and Water Regeneration project aims to capture the environmental footprint of feed practices on poultry farms.
- True.
- False.
- The DSWR project began its work in 2021 with a survey of dairies in __ major milk production regions of the country.
- two
- three
- four
- six
- What does “dynamic” and “static” refer to when describing the dynamic or static measurement system?
- If a researcher has to manually measure the sample in the lab.
- If the air is or is not circulating during the measurement.
- If the chamber can or cannot be moved around the field.
- Whether or not the chamber has a lid.
- GRACEnet stands for “Greenhouse Gas Reduction Through Agricultural Carbon Enhancement Network.”
- True.
- False.
- What data are researchers in the DSWR project collecting with infiltrometers?
- Field-saturated hydraulic conductivity.
- Soil temperature.
- Air temperature.
- Nitrous oxide emissions.
- For the DSWR project, what is a typical daily change in oxygen levels in intermediate or well-drained soils?
- 9–11%.
- 10–20%.
- 19–21%
- 15–30%
- Why might researchers be missing some measurements for GHG emissions during the winter?
- They are using instruments that cannot operate in winter temperatures.
- They are missing GHG releases that occur during freeze–thaw events.
- They are only measuring CO₂ and not CH₄ or N₂O.
- They are using instruments that cannot operate in precipitation.
- Feedback from DWSR researchers is helping LI-COR update both the instrument’s hardware and software.
- True.
- False.
- The data loggers used by DWSR to measure temperature, moisture, and oxygen do not allow the researchers to remotely access these data.
- True.
- False.
Text © . The authors. CC BY-NC-ND 4.0. Except where otherwise noted, images are subject to copyright. Any reuse without express permission from the copyright owner is prohibited.


