Climate-Smart IPM: Key to U.S. Ag Resilience


Farmers, ranchers, and foresters are facing increasing challenges related to changing climate and weather, manifested in rising average temperatures, more frequent extreme rainfall events, extended drought, and heat waves. These changes are also impacting pest abundance and distribution, creating new pest problems and straining current pest management options and decision-making. Key factors for U.S. agriculture and producer resilience in tackling new environmental and pest challenges lie in the ability of producers to apply effective, economical integrated pest management (IPM) approaches and in support for research and development of new and renewed IPM tactics and systems to meet 21st century needs. Earn 0.5 CEUs in Integrated Pest Management by reading this article and taking the quiz.
Farmers, ranchers, and foresters are facing increasing complexity and costs as they are called on not only to produce abundant, safe, and affordable food and fiber, but also to address critical global challenges. To respond to the call, producers are adopting practices that provide significant benefits well beyond the borders of their operations.
Challenges include changing climate and weather, manifested in rising average temperatures, more frequent extreme rainfall events, extended drought, and heat waves. These changes are also impacting pest abundance and distribution, creating new pest problems and straining current pest management options and decision‐making.
Key factors for U.S. agriculture and producer resilience in tackling new environmental and pest challenges lie in the ability of producers to apply effective, economical integrated pest management (IPM) approaches and in support for research and development of new and renewed IPM tactics and systems to meet 21st century needs.
Climate Change 101
Weather changes from day to day and hour by hour. Weather is what determines what we wear on any particular day. Climate is the picture we paint when we compile weather events over the long term. Our local climate determines what clothing we have in our closets and dressers.
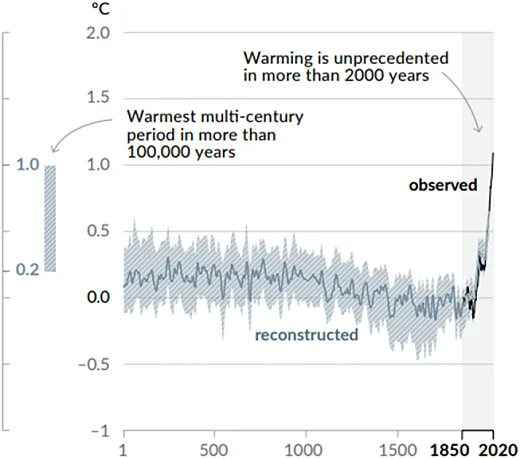
Climate records are clear. While climate history shows frequent ups and downs in annual global surface temperature over the past 2,000 years, there has been a sharp uptick since about 1850 (Figure 1).
How do we know what temperatures were 2,000 years or more ago? Temperature history has been recorded in geologic evidence—soil cores—and biological evidence—tree rings. These historical records are referred to as paleoclimate archives.
What is driving the temperature increase? The frequent ups and downs in the historical record are the result of changes in solar and volcanic activity over time. To explain the recent sharp increase, the best evidence we have points to human activity, and specifically, changes in greenhouse gas concentrations in the atmosphere, including carbon dioxide, methane, and nitrous oxide.
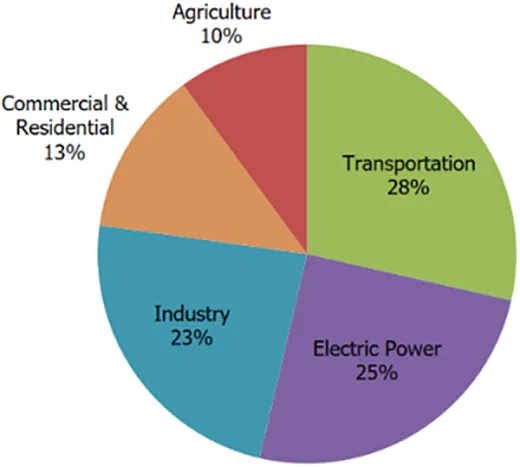
What’s causing the greenhouse gas increase? The largest source of greenhouse gas emissions from human activities in the United States is from burning fossil fuels for electricity, heat, and transportation (Figure 2).
In addition, humans have made extensive changes in land use, increasing heat‐absorbing asphalt, concrete with roads, buildings, and roofs. Deforestation has reduced acreage of carbon‐dioxide‐absorbing vegetation. Humans have also burned peatlands to renew vegetation and improve hunting, releasing carbon stored in the peat into the atmosphere.
The increase in global surface temperatures since U.S. Civil War days is about 3.6°F. That doesn’t sound like much, so why should we be concerned? As global surface temperatures have warmed, a host of other climate indicators have also changed, including some which are impacting human health and our ability to meet our food and fiber needs like heat waves, extreme rainfall events, and extended drought.
Here is a selection of key U.S. climate indicators (USEPA, 2023):
- Nine of the top 10 warmest years on record have occurred since 1998.
- Since 1896, average winter temperatures have increased by nearly 3°F across the contiguous 48 states.
- Spring temperatures have increased by around 2°F; summer and fall temperatures have increased by about 1.5°F.
- Heat waves are occurring three times more often than they did in the 1960s; about six per year compared with two per year.
- Nationwide, 9 of the top 10 years for extreme one‐day precipitation events have occurred since 1996.
What’s Agriculture’s Role in Climate Change?
Increases in greenhouse gas emissions are the dominant driver of climate change. Human activities—primarily burning fossil fuels for heat, electricity, and transportation—contribute about 54 billion metric tons, or gigatons (Gt), of emissions annually globally (Table 1; IPCC, 2021). Food systems, including agriculture, processing, and distribution, account for 18 Gt (Figure 3). Agriculture is about 7 Gt of that with livestock contributing 3 Gt and crop production 2 Gt.
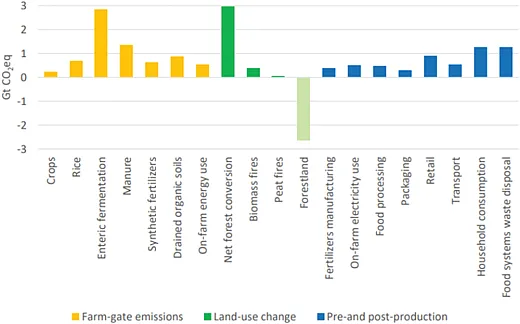
Agriculture thus contributes about 13% to our global greenhouse gas challenge and also has enormous potential to contribute to greenhouse gas reduction goals in the following ways:
- Reducing conversion of forest and wetlands to agricultural production.
- Retaining and increasing carbon in grassland and cropland soils by reducing tillage, cover cropping, maintaining living roots in the soil year‐round, fallowing, or converting marginal land to conservation reserves with perennial vegetation.
- Managing nutrients to optimize input use, including nitrogen, which currently largely depends on consumption of fossil fuels.
- Adjusting livestock feed to reduce methane release through “enteric fermentation,” a normal process that occurs when anaerobic microbes ferment feed in animal digestive tracts.
- Managing manure carefully to minimize methane release.
- Adjusting rice production approaches to minimize methane release.
- Reducing fossil fuel consumption in farming activities.
- Providing sites for solar and wind energy production.
| Total emissions from human activity | 54 Gt | 100% |
|---|---|---|
| Food systems | 18 | 33 |
| Agriculture | 7 | 13 |
| Livestock | 6 | 6 |
| Crops | 2 | 4 |
What About IPM?
Pest management activities generate emissions through energy from fossil fuels used to produce, transport, store, apply, and dispose of inputs. Pest management interventions can also release carbon from the soil through tillage used to manage weeds, for example.
Integrated pest management can help mitigate climate change in multiple ways:
- Adaption. IPM tactics can help detect and respond to new pest arrivals, for example, as warmer climates allow species to thrive in regions that were formerly too cold. Producers may tap specific IPM tools such as monitoring traps or sampling routines even ahead of new species arrivals for early detection of potential new pests.
- Carbon sequestration. Examples include planting cover crops or intercropping to improve biological control, or help manage weeds, nematodes, or soil pathogens. These plantings remove CO2 from the atmosphere. Carbon in roots and non‐harvested portions of aboveground plant parts contributes to soil organic matter.
- Reduce emissions. When pest management interventions are avoided, for example, by using scouting and thresholds, or monitoring weather for conditions not favorable for diseases, emissions associated with production, transport, storage, application, and waste disposal are also avoided. When an intervention is needed, some options may generate fewer emissions. Finally, when yield is improved, for example, by precisely timing inputs, fewer emissions are generated per unit of production.
- Supporting other efforts. Ensuring continued IPM can support other mitigation efforts, such as transitioning to livestock feed crops that reduce methane emissions from livestock or changing rice production methods to reduce emissions.
Examples of IPM in Action
Life‐cycle analyses of three biopesticides compared with synthetic chemical alternatives revealed potential to generate CO 2 emissions savings of 5,500, 9600, and 12,800 metric tons from each $1 million in sales of the products (Boundless 2021, 2022a, 2022b).
Researchers estimated that using pomace produced by the tomato‐processing industry in California to biosolarize soil as an alternative to chemical fumigants and herbicides could eliminate as much as 8,500 tons of CO 2 emissions annually (Oldfield et al., 2017).
Greenhouse gas contributions from crop protection inputs—chemical and non‐chemical—are generated from production, storage, transport, application, and waste management. Contributions from pesticide application are generally roughly estimated (e.g., Field to Market captures number of applications by type—insecticide, fungicide, and herbicide) and use a factor for each type to calculate values for their greenhouse metric (Field to Market, 2017).

The list of IPM practices with climate change mitigation potential is long and broad. A recent review of USDA‐NRCS practice standards and technical documents identified more than 40 IPM practices with potential for improving adaptation, emissions reduction, and sequestration.
What’s Needed to More Fully Benefit from IPM’s Mitigation Potential?
Both public and private opportunities are emerging to recognize contributions to climate change mitigation. For example, when purchasing air travel or renting a car, you may be presented with options to pay more to offset the greenhouse gas emissions generated by your travel. Those funds may be applied through a marketplace to the costs of activities that mitigate a proportional amount of emissions, perhaps reforestation or clean energy projects.
Government‐supported opportunities are also expanding, including in the U.S. through the $369 billion recently committed to climate change mitigation through the Inflation Reduction Act (IRA) and Bipartisan Infrastructure Relief Act. The IRA alone provides $19.5 billion dedicated to climate‐smart agriculture.
However, agriculture currently accounts for less than 2% of the activity in climate change mitigation markets. Integrated pest management was not a part of the discussion for commitment of new NRCS investments until recently.
Participation for IPM in climate initiatives is in its infancy. Some key actions needed to benefit from IPM include:
- Increasing awareness of and appreciation for IPM’s potential among producers and producer groups, crop advisers, policymakers, program leaders, and the public.
- Securing a seat at the table for IPM in current and future discussions and workgroups on public and private climate‐smart agriculture initiatives.
- Developing consensus processes and protocols for assigning climate benefit valuations to IPM practices.
- Identifying and prioritizing IPM practices for valuation, including identifying and filling gaps in data needed to assign value.
- Outreach to producers and influencers, including CCAs to promote participation in opportunities for technical and financial assistance as they emerge.
Light at the End of the Tunnel
This year, the Climate, Ecosystem Services, and IPM Alliance was formed with the intention of building a “big tent” public–private consortium of producers, advisers, input and technology providers, risk managers, ecosystem service market developers, policymakers, and others to shepherd an agenda for IPM in U.S. agriculture to better meet current challenges. The agenda includes updating federal programs for IPM research and implementation, which have not been refreshed since the 1990s. It also includes a focus on climate opportunities as well as untapped opportunities in biodiversity and soil health.
The Alliance grew out of a series of online discussions with about 20 leaders in U.S. agriculture last fall. These leaders developed a priority list of opportunities and challenges and singled out climate opportunities as a “hot iron” topic given current public and private investments. Consortium leaders, including the author, are currently recruiting participation and support, and pursing foundational tasks including literature review, gap analysis, expert lists, and other resources. For more information, readers may contact the author at ipmworks@ipminstitute.org.
Acknowledgments
Preparation of this article was supported by USDA National Institute of Food and Agriculture, Crop Protection and Pest Management Program through the North Central IPM Center, and by the Biological Products Industry Alliance and ProFarm, a subsidiary of Bioceres.
References
Boundless. (2021). Arbor environmental impact profile.
Boundless Impact Research and Analytics. Boundless (2022a). BIOst nematicide climate impact profile.
Boundless Impact Research and Analytics. Boundless (2022b). Rizobacter environmental impact profile.
Boundless Impact Research and Analytics.
FAO. (2022). Greenhouse gas emissions from agrifood systems: global, regional and country trends, 2000–2020. https://www.fao.org/3/cc2672en/cc2672en.pdf
Field to Market. (2017). Pesticides in the Fieldprint Platform and Field to Market metrics. https://members.fieldtomarket.org/sites/default/files/2020‐01/Metric‐Focus‐How‐Pest‐Management‐Impacts‐Scores.pdf
Intergovernmental Panel on Climate Change. (2021). Climate change 2021: The physical science basis. https://www.ipcc.ch/report/ar6/wg1/downloads/report/IPCC_AR6_WGI_SPM_final.pdf
Oldfield, T.L., Achmon, Y., Perano, K.M., Dahlquist‐Willard, R.M., VanderGheynst, J.S., Stapleton, J.J., Simmons, C.W., & Holden, N.M. (2017). A life cycle assessment of biosolarization as a valorization pathway for tomato pomace utilization in California. Journal of Cleaner Production, 141, 146–156. https://doi.org/10.1016/j.jclepro.2016.09.051
USEPA. (2023). Climate change indicators in the United States. USEPA. https://www.epa.gov/climate‐indicators
Glossary
Climate change. Long‐term shifts in weather patterns, including temperature, resulting from natural variation in solar and volcanic activity, plus human activities, primarily the burning of fossil fuels for electricity, heat, and transportation.
CO 2 equivalents (CO 2e). Not all greenhouse gases have the same warming potential. Therefore, a calculation is used to translate any greenhouse gas to this standardized number of metric tons. For example, amounts of nitrous oxide or methane emissions are run through a formula to convert those amounts into the equivalent amount of carbon dioxide in terms of warming potential.
Gigatons (Gt). One billion metric tons. Greenhouse gas emissions are often expressed in Gt.
Greenhouse gas (GHG). Gases which trap heat when released into the atmosphere, primarily carbon dioxide (CO2), nitrous oxide (N2O), and methane (CH4). Carbon dioxide represents about 80% of the total greenhouse gas emissions in the U.S. each year, followed by CH4 at 12% and N2O at 6%.
Resilience
/rɪˈzɪliəns/noun • English Capacity to withstand or to recover quickly from difficulties; toughness.
—Oxford Languages
Self-Study CEU Quiz
Earn 0.5 CEUs in Integrated Pest Management by taking the quiz. For your convenience, the quiz is printed below. The CEU can be purchased individually, or you can access as part of your Online Classroom Subscription.
- An increase in global surface temperatures is evident in data recorded by humans and in geological and biological records, including soil cores and tree rings.
- True.
- False.
- What best explains the increase in global surface temperatures we've observed over the past two centuries?
- Heat generated by machines that burn fossil fuels.
- An increase in solar and volcanic activity.
- An increase in greenhouse gas concentrations in the atmosphere, coupled with land use changes.
- Human and livestock population increases resulting in increased carbon dioxide exhalation.
- Which of the following is NOT one of the most important greenhouse gases?
- Carbon dioxide.
- Methane.
- Freon.
- Nitrous oxide.
- How can IPM help mitigate climate change?
- Reducing emissions of greenhouse gases.
- Helping producers adapt to changes in weather and pests.
- Sequestering carbon.
- Supporting efforts to transition non-pest management practices that mitigate climate change.
- All of the above.
- Which is the most pressing critical need to advance IPM's potential to mitigate climate change?
- Develop new IPM practices.
- Reduce input use.
- Fill research and data gaps to assign a mitigation value to specific IPM options.
- Adopt organic or regenerative practices.
Text © . The authors. CC BY-NC-ND 4.0. Except where otherwise noted, images are subject to copyright. Any reuse without express permission from the copyright owner is prohibited.


