Blue Waters, Green Fields
Going Beyond BMPs and 4Rs to Control Future Phosphorus Loss to the Environment


Controlling future phosphorus (P) loss will not be simple. The main nutrient “culprit” in freshwater contamination, P, becomes available only in its dissolved inorganic form in solution; and that solubility is also what can contaminate the environment if the P ends up in the wrong place. This article examines future P loss measures for agricultural systems. Beyond continued vigilance with regards to best management practices (BMPs), future mitigation tools include physical filters of P loss from crop fields, updating P soil‐test calibrations, stream buffers, cover crops, biologic products that may alter P availability, enzyme additives, and potential P recycling and trading markets. Earn 1.5 CEUs in Soil & Water Management by reading this article and taking the quiz.
Controlling future phosphorus (P) loss will not be simple. The main nutrient “culprit” in freshwater contamination, P, becomes available only in its dissolved inorganic form in solution; and that solubility is also what can contaminate the environment if the P ends up in the wrong place. Phosphorus freshwater contamination triggers eutrophication, the over‐enrichment of water. This often causes algal blooms and hypoxia, which kills fish. Freshwater algal blooms cost the U.S. $4.6 billion annually, according to the international Global Ecology and Oceanography of Harmful Algal Blooms research program.
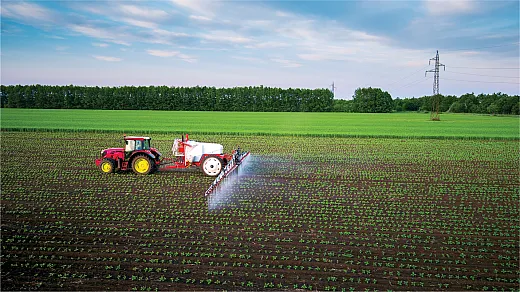
“The irony is that we want large nutrient levels in crop soils but very little concentrations in surface waters,” says Chad Penn, USDA‐ARS National Soil Erosion Research Laboratory scientist and Purdue University adjunct professor. He studies P contamination to Lake Erie from Ohio’s Maumee River watershed. Since soil‐solution P contains relatively low P concentrations compared with crop needs, P must be continually replenished from soil minerals. This happens by dissolution, from mineral surfaces by desorption, and from organic matter by mineralization, to replace what plants take up as inorganic orthophosphate, a negatively charged ion.
This article examines future P loss measures for agricultural systems. Beyond continued vigilance with regards to best management practices (BMPs), future mitigation tools include physical filters of P loss from crop fields, updating P soil‐test calibrations, stream buffers, cover crops, biologic products that may alter P availability, enzyme additives, and potential P recycling and trading markets.
Agricultural demand over the last 75 years has increased global P mobilization fourfold (Falkowski et al., 2000; Villalba et al., 2008). “The Green Revolution that enabled a doubling in global human population also resulted in P losses so great that only one‐fifth of the P mined specifically for food production is incorporated into the food consumed” (Cordell et al., 2009).
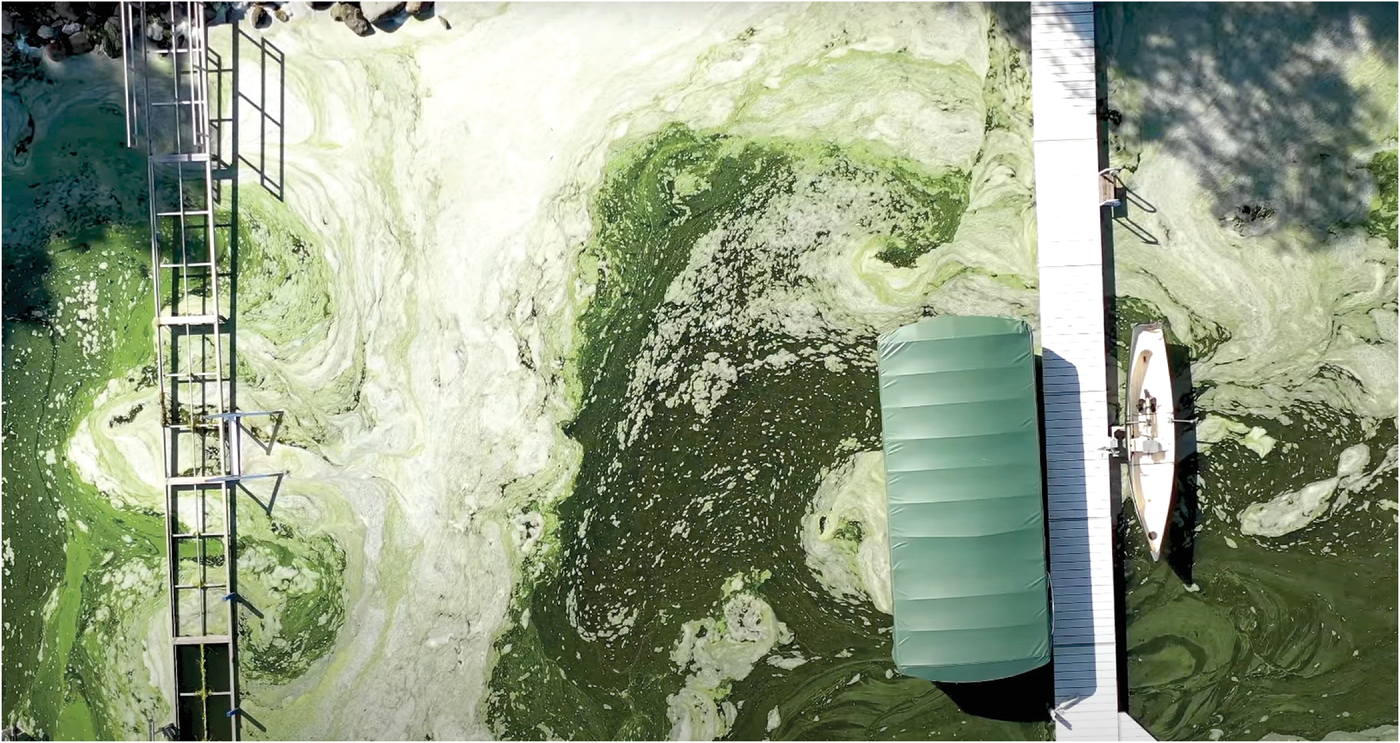
Although Lake Erie is the poster child of P‐related algal blooms, many lakes and reservoirs also suffer from them. Central Wisconsin’s Lake Mendota had 146 days of beach closures from cyanobacteria (algae from excess P) in 2019, according to the 2019 State of the Lakes Report. That year’s P loading was also 40% higher than 2018. Lake Mendota is surrounded by some of Wisconsin’s most productive dairy and commodity grain farms. Other waters under scrutiny to clear up agricultural P pollution include Lake Champlain, Lake Cayuga, and the Chesapeake Bay.
The double‐edged sword of P is that the very nature of its bioavailability in water in dissolved form means that crops can take it up, but also that it can be lost to feed harmful algae blooms in streams and lakes. Agriculture’s central role in the P contamination problem is evident with Lake Erie’s tremendous eutrophication and re‐eutrophication problems. Now that wastewater treatment plant P loss has largely been mitigated, the problem results largely from increased agriculture intensification, land use changes, and high runoff (Michalak et al., 2013). Intensified agriculture has also been noted in other lakes’ P‐related algal problems (Baker et al., 2014).
An algae bloom in 2018 along the southern shore of Lake Mendota in Madison, WI. Drone footage by Phil Brinkman.
“If it was easy to reduce agricultural P loss, we’d already be doing it,” says University of Illinois crop physiologist Fred Below. “Consider that not much of applied P is immediately available. If farmers’ crops absorb more than 20% of applied P in the first year, that would be pretty good.”
Global P use efficiency averages 17% of applied P that is being used by the plant that same season, according to Dhillon et al. (2017).
What Illinois Is Doing
Illinois sends the most P to the Gulf of Mexico’s “dead zone.” It is also the second largest N contributor, according to modeling from the United States Geological Survey (USGS). The dead zone is caused by P‐ and N‐triggered algae eutrophication. Much of the P and N contributions come from Mississippi River basin farm nutrients. By 2025, Illinois aims to reduce P exports by 25% with greater long‐term reductions. The state’s P loads increased by 35% above a 1980 to 1996 benchmark, averaged from 2015 to 2019. This is according to the latest biennial Illinois report on its reduction strategy.
“Adding P fertilizer at the start of the season, or in the fall for next spring’s crop, can potentially risk P inputs being tied up in less available forms,” says Andrew Margenot, University of Illinois soil scientist in the Department of Crop Sciences. “There is a lot of mineral P in our soils’ parent material (e.g., 400 to 2,400 lb/ac, or 200 to 1,200 mg/kg of total P in the surface 0 to 6 inches alone). Typically, less than 1% is in a plant‐available form in soil solution. Unlike N, the fertilizer P that is not absorbed by the crop in that same season is not generally lost since P is relatively immobile, has no gas loss pathway, and binds to soil minerals via sorption reactions.”
“This results in legacy P though not all of it will be available for the crop,” Below says. “P availability is important because half of corn’s P requirements are after flowering.”
Ag Faulted for Lake Erie
Phosphorus contamination of Lake Erie via Ohio’s Maumee River watershed was largely responsible for Toledo shutting down its drinking water supply in 2014. “Don’t drink or even touch the tap water” was the edict to 500,000 residents there. “Since municipal wastewater treatment P sources have been mostly addressed, agricultural sources in the Maumee River have become the main concern,” says USDA’s Penn. His lab has the nation’s most comprehensive water quality field monitoring, focusing on the western Lake Erie basin’s re‐eutrophication problem.
“We have a strong correlation between P load and Maumee River water flow volume. P loss is partly driven by hydrology,” he says.
Phosphorus‐Removal Structures
Looking to the future, beyond BMPs and the 4Rs, how can agriculture address this problem?
Penn’s USDA‐ARS team has designed P‐removal structures to filter out P before it can be transported.
“You may trap 10 lb of P, which makes a huge positive impact on water quality, but what is a farmer’s economic incentive to remove such a small amount (agronomically)?” he asks.
That is another part of the P paradox—P’s lifecycle (mitigation) cost extends beyond its preliminary farm agronomic cost.
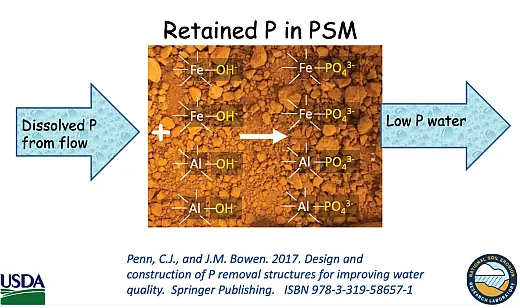
These underground P‐removal structures filter out dissolved and particulate P. (Dissolved P is the more potent eutrophication agent.) They’re singularly effective in removing dissolved P, unlike BMPs and other methods. Phosphorus‐removal structures are cost‐shared under NRCS Standard 782 to varying degrees.
The P removed from the soil binds strongly to the filters’ iron or aluminum where it remains. The effluent contains less P. Several companies are figuring out how best to apply the trapped P. See https://youtu.be/LUfZo9zBk6I and https://vimeo.com/723533892 for more information on P removal structures.
Updating Phosphorus Soil Tests
Big data has a lot of potential to update the modeling and algorithms behind measuring soil tests’ plant‐available P. Yet, most soil tests were developed between the 1940s and the 1970s. Consider, for example, how much new crop genetics and planting populations have affected P, N, and K recommendations; not to mention research advances in soil minerology and other variables. For example, Ohio’s Maumee River watershed has kaolinitic clays, which have cracking characteristics that allow more soil P to leach through the profile compared with non‐cracking clays, according to Deanna Osmond, North Carolina State University professor of soil fertility and watershed management. She leads this effort to update soil tests.
“There’s a misconception that farmers fertilize a crop. But really, it’s the soil that fertilizes the crop,” Osmond says. “State soil‐test variations are astounding—with differences up to a twofold factor. Soil is a dynamic environmental filter. You must be mindful about what you put into it. Before this effort, U.S. states’ soil test models resulted in different nutrient recommendations on opposite sides of state borders,” she says. “Widespread adoption of the Mehlich‐3 extraction has not reduced state variation in fertilizer P and K rate recommendations. For states using Mehlich‐3, soil test critical concentrations ranged from 30 to 75 mg P/kg for corn grain and 60 to 175 mg K/kg for warm‐season grass hay production. Uniform soil‐testing terminology, sample collection guidelines, extraction methods, and interpretations across common physiographic regions, soils, and state lines remain a challenge.” (See Zhang et al., 2021.)
Hosted by USDA‐ARS, 38 land grant university and numerous ARS soil fertility scientists have created the Fertilizer Recommendation Support Tool (https://soiltestfrst.org/), or FRST. Users adjust site‐specific variables such as soil test method, geographic location, yield goals, and crops to identify soil‐test critical P and K recommendations. Initially, FRST will support P and K recommendations for 15 major agricultural crops including corn, cotton, grain sorghum, peanuts, soybean, and wheat. It will expand to other cropping systems, micronutrients, and worldwide growing regions.
Streambank Buffers
“P loss from streambank erosion conservatively contributes one‐third of present American P losses,” says Keith Schilling, Iowa State University geologist, who documents this. “We estimated that streambanks contributed approximately 31% of Iowa’s total P export over an 18‐year period.” The ranges are from 3 to 98% of P lost depending on soil types, topography, and other variables. (This excludes results from livestock grazing near streams.)
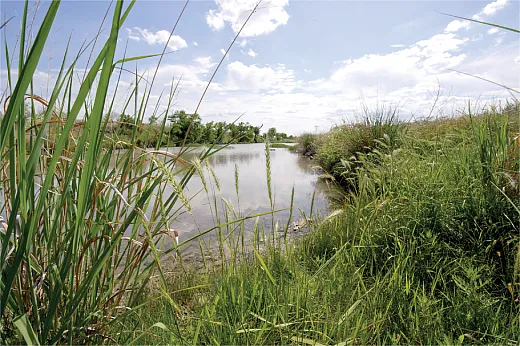
Buffer laws such as Minnesota’s (and the Netherlands’) “are one of the best things we can do,” Margenot says. “[Buffers] filter out particulates, protect the bank, and reduce overland erosion which carries P.” Buffer widths more than 16.5 ft are most effective, according to University of Minnesota research. “However, over time, buffer strips can become a source of P in surface runoff, so farmers will also need to manage these areas to maintain effectiveness as P catchments,” says Adam Herges, Mosaic senior sustainability agronomist.
Cover Crops
Studies have shown that with cover crops, there is a reduction in particulate P loss with no change or an increase in dissolved‐P losses (Kleinman et al., 2005; Cober et al., 2019; Kovar et al., 2011; Lozier et al., 2017; Carver et al., 2022).
Enzymes and Microorganisms
Some firms are developing enzymes to apply in‐furrow that mineralize soil P from parent material to become more available to plants. “There will be a lot of technology around this and biostimulant‐signaling pathways,” Herges says.
Phosphate‐solubilizing microorganisms (PSMs) dissolve organic P and solubilize inorganic P minerals. Along with other microbes, they release phosphatase enzymes and organic acids, reduce soil pH, and increase chelation activities with additional P adsorption sites. Phosphate‐solubilizing microorganisms can release the estimated 80% of soil P that is unavailable to plants into more available forms. They are most abundant in the rhizosphere.
“These technologies may help to reduce overall P‐application rates in the short term by increasing nutrient use efficiencies, but over time, PSM microorganisms used to unlock sediment‐bound P will eventually mine the soils, so additional P applications will be needed in the future,” Herges says. “There could be a balance between unlocking soil P with enzymes and then reducing rates to slowly reduce soil P levels while optimizing crop yields.”
Soil Sensors and Phosphorus Recycling
Soil moisture probes track soil salts and nutrients moving through soil profiles with water. This makes it easier to modify prescriptions and application timing and save fertilizer costs, according to Herges.
Recycling P may become another promising concept. Companies like Ostara are recovering nutrients from municipal wastewater treatment plants and converting them into a fertilizer product called struvite. It is an inorganic, granular, slow‐release P form. Struvite’s low water solubility makes it less likely to move from the field into surrounding waterways. Ongoing field experiments from Margenot’s lab show that struvite can substitute for traditional highly water‐soluble P fertilizers without crop yield loss.
In soils with adequate soil‐test‐P levels as measured by Bray or Mehlich‐3 extraction, struvite appears to fully substitute for monoammonium phosphate (MAP) or diammonium phosphate (DAP) without negatively impacting corn, soybean, or wheat yields. The use of radioisotopic labeling of P in struvite and MAP by Margenot’s team has identified struvite’s contributions to corn uptake while mitigating high‐soil‐solution P concentrations prone to leaching.
Several organizations globally are focused on sustainable P recycling. Europe is ahead of the U.S. on this front: “The European Sustainable Phosphorus Platform (ESPP) has focused on a circular P economy and reducing P impacts to the environment for at least a decade,” says Mosaic’s Herges. “The ESPP consortium includes members that are involved in mining, wastewater treatment, P reuse and recycling, food and feed as well as NGOs and universities.”
“The mass balance approach measures the remainder of what enters and leaves the P‐cycle system,” Margenot says. “If your P bank account balance is positive, you do not need to apply more P.”
In the U.S, the Sustainable Phosphorus Alliance (SPA), at Arizona State University, is modeled after ESPP. Recently, the National Science Foundation funded a new center, Science and Technologies for Sustainable Phosphorus (https://steps‐center.org/), or STEPS.
A recent Journal of Environmental Quality report (https://bit.ly/3yJqxYD) describes the feasibility of recycling P: “Phosphorus loss from fertilizer and sewage is mostly a one‐way street,” says Margenot, lead author. “Wastewater treatments precipitate phosphates to be recaptured or recovered. However, the resulting phosphate minerals are water‐insoluble and therefore less available to plants. We can play with recovery chemistry to match the right soil type and crop type to overcome these challenges.”
The concept needs to become more cost effective in order to scale.
Phosphorus‐Trading Markets
Phosphorus‐trading schemes similar to carbon credit trading could be part of the solution, creating incentives for farmers to recycle P and save money on P inputs, Margenot says.
These tools join the BMP arsenal in mitigating P loss in the future. “BMPs are effective in reducing P loss, but there’s still a long ride before they make a difference in reducing P contributions to the environment,” Illinois’ Below says.
Soil Phosphorus Loss Will Limit Future Food, Feed Production
We don’t know much yet about how large P global reserves are, and science is not yet able to fully control P loss to the environment. Erosion alone will deplete soil P stocks with current P fertilization rates in the coming century as commercial fertilizer supplies wane while encumbering significant impacts on water quality from stream and lake sediments, according to a recent peer‐reviewed study (Alewell et al., 2020). Erosion caused by water could cause half of future soil P losses, the study says. “The one‐way P flow from mineral reserves to farm soils to fresh waters and finally into oceans is already beyond the safe operating space for sustainable human development,” the authors write.
Almost one‐third of global cropland had P deficits (MacDonald et al., 2011). Morocco has the world’s largest P unmined reserves, but it’s unclear how large they are. So “it is uncertain whether or not P supply from rock reserves in future decades will be a real physical scarcity or be limited by economic and technical constraints,” the study says.
Ulrich and Frossard (2014) argue that the main problem won’t be geological P availability but rather fertilizer access or environmental regulations. Regardless, soil erosion from water contributes to potential future P shortages in a major way. It is the most crucial potential P loss to the environment and more controllable perhaps than offshore supplies.
“There is general agreement that P losses due to soil erosion are a crucial parameter in the global P cycle,” Alewell et al. (2020) conclude, “but estimating those rates is highly uncertain owing to the uncertainty of soil erosion rates and/or the limited availability of global soil P data.”
Newly available spatially discrete data now enables scientists to quantify P loss from soil erosion by water (Alewell et al., 2020).
“P loss in agricultural systems, especially in areas with low or no future P fertilizer input, depends on soil erosion and poses an imminent threat to system functioning,” Alewell et al. (2020) conclude.
References
Alewell, C., Ringeval, B., Ballabio, C., Robinson, D.A., Panagos, P., & Borrelli, P. (2020). Global phosphorus shortage will be aggravated by soil erosion. Nature Communications, 11, 4546. Baker, D.B., Confesor, R.B., Ewing, D.E., Johnson, L.T., Kramer, J.W., & Merryfield, B.J. (2014).
Phosphorus loading to Lake Erie from the Maumee, Sandusky, and Cuyahoga Rivers: The importance of bioavailability. Journal of Great Lakes Research, 40(3), 502–517. https://doi.org/10.1016/j.jglr.2014.05.001
Carver, R.E., Nelson, N.O., Roozeboom, K.L., Kluitenberg, G.J., Tomlinson, P.J., Kang, Q., & Abel, D.S. (2022). Cover crop and phosphorus fertilizer management impacts on surface water quality from a no‐till corn‐soybean rotation. Journal of Environmental Management, 301, 113818.
Cober, J.R., Macrae, M.L., & Van Eerd, L.L. (2019). Winter phosphorus release from cover crops and linkages with runoff chemistry. Journal of Environmental Quality, 48(4), 907–914. https://doi.org/10.2134/jeq2018.08.0307
Cordell, D., Drangert, J.‐O., & White, S. (2009). The story of phosphorus: Global food security and food for thought. Global Environmental Change, 19(2), 292–305. https://doi.org/10.1016/j.gloenvcha.2008.10.009
Dhillon, J., Torres, G., Driver, E., Figueiredo, B., & Raun, W.R. (2017). World phosphorus use efficiency in cereal crops. Agronomy Journal, 109, 1670–1677. https://doi.org/10.2134/agronj2016.08.0483
Falkowski, P., Scholese, R.J., Boyle, E., Canadell, J., Canfield, D., Elser, J., …. & Steffen, W. (2000). The global carbon cycle: A test of our knowledge of Earth as a system. Science, 290, 291–296.
Kleinman, P.J.A., Salon, P., Sharpley, A.N., & Saporito, L.S. (2005). Effect of cover crops established at time of corn planting on phosphorus runoff from soils before and after dairy manure application. Journal of Soil and Water Conservation, 60(6), 311–322.
Kovar, J.L., Moorman, T.B., Singer, J.W., Cambardella, C.A., & Tomer, M.D. (2011). Swine Manure Injection with Low‐Disturbance Applicator and Cover Crops Reduce Phosphorus Losses. Journal of Environmental Quality, 40(2), 329–336. https://doi.org/10.2134/jeq2010.0184
Lozier, T.M., Macrae, M.L., Brunke, R., & Van Eerd, L.L. (2017). Release of phosphorus from crop residue and cover crops over the non‐growing season in a cool temperate region. Agricultural Water Management, 189, 39–51.
MacDonald, G.K., Bennett, E.M., Potter, P.A. & Ramankutty, N. (2011). Agronomic phosphorus imbalances across the world’s croplands. PNAS, 108, 3086–3091.
Michalak, A.M., Anderson, E.J., Beletsky, D., Boland, S., Bosch, N.S., Bridgeman, T.B., … & Daloglu, I. (2013). Record‐setting algal bloom in Lake Erie caused by agricultural and meteorological trends consistent with expected future conditions. PNAS, 110, 6243–6244. https://doi.org/10.1073/pnas.1216006110
Ulrich, A.E., & Frossard, E. (2014). On the history of a reoccurring concept: phosphorus scarcity. Science of the Total Environment, 490, 694–707. https://doi.org/10.1016/j.scitotenv.2014.04.050
Villalba, G., Liu, Y., Schroder, H., & Ayres, R.U. (2008). Global phosphorus flows in the industrial economy from a production perspective. Journal of Industrial Ecology, 12(4), 557–569. https://doi.org/10.1111/j.1530‐9290.2008.00050.x
Zhang, H., Antonangelo, J., Grove, J., Osmond, D., Slaton, N.A., Alford, S., … & Wang, J. (2021). Variation in soil‐test‐based phosphorus and potassium rate recommendations across the southern USA. Soil Science Society of America Journal, 85, 975–988. https://doi.org/10.1002/saj2.20280
Self-study CEU quiz
Earn 1.5 CEUs in Soil & Water Management by taking the quiz. For your convenience, the quiz is printed below. The CEU can be purchased individually or you can access as part of your Online Classroom Subscription.
Phosphorus runoff from agricultural fields drives harmful freshwater algal blooms in water bodies across the U.S. What’s the dollar amount associated with this damage annually?
a. $2.6 billion.
b. $2.9 billion.
c. $4.2 billion.
d. $4.6 billion.2. What percentage of global cropland has P deficits?
a. About one‐third.
b. About one‐fifth.
c. About one‐half.
d. All cropland has P deficits.3. The planet has limited reserves of P. Which country has the most?
a. Russia.
b. Morocco.
c. Australia.
d. China.4. Agricultural demand for P over the last 75 years has
a. doubled
b. tripled.
c. quadrupled.
d. remained steady.5. According to a study cited in this paper, what percentage of P that is applied on crops globally gets used by the plant that same season, on average?
a. 17%.
b. 27%.
c. 33%.
d. 39%.6. A USDA‐ARS team has designed structures to filter out P from fields before it reaches waterways. Which of the following elements are used by the device “trap” the P?
a. Iron.
b. Zinc.
c. Aluminum.
d. Both a and c.7. In an effort to update outdated phosphorus soil tests and bring consistency across states, a group of USDA and university scientists created a new tool called the
a. Nutrient Assessment Manager.
b. Phosphorus Buster.
c. Fertilizer Recommendation Support Tool.
d. P‐FORM.8. Eroding streambanks are a significant factor in P losses. In one study cited in this paper, erosion was responsible for almost a third of all the P export in what state?
a. Illinois.
b. Indiana.
c. Iowa.
d. Ohio.9. Stream buffers are effective at sequestering excess P from fields. However, over time, these buffers can turn from P sinks to P sources.
a. True.
b. False.10. Some scientists are looking at adding enzymes and microorganisms to soil that would transform P that is unavailable to plants—which is the majority of the P—into available P. But that’s seen as short‐term strategy because the enzymes and microbes would eventually mine all the soil P.
a. True.
b. False.11. Several efforts are underway to develop systems for recycling P. Which of the following efforts does the article mention?
a. Companies are using wastewater effluent to create struvite, which contains a less soluble form of P suitable for use as a slow‐release fertilizer.
b. A group of Wisconsin farmers launched the “Low‐P Pledge” initiative.
c. The National Science Foundation funded a new center on sustainable phosphorus.
d. Both a and c.
e. Both a and b.12. Which of the following do scientists use as the primary metric for predicting and assessing harmful algal blooms triggered by phosphorus?
a. Legacy P.
b. Banding P.
c. Broadcasting P.
d. Dissolved P.13. According to a researcher cited in the story, Illinois is the largest contributor of P loss to the environment due to ongoing overapplication of P.
a. True.
b. False.14. The more P that is applied to soils, the more weakly it binds to the soil, and the easier it dissolves and is lost to the environment.
a. True.
b. False.15. Similar to carbon‐trading markets, phosphorus‐trading markets are being considered as a means of mitigating the impact of agricultural P losses.
a. True.
b. False.
Text © . The authors. CC BY-NC-ND 4.0. Except where otherwise noted, images are subject to copyright. Any reuse without express permission from the copyright owner is prohibited.


