The Apples and Oranges of Measuring Greenhouse Gases in Croplands
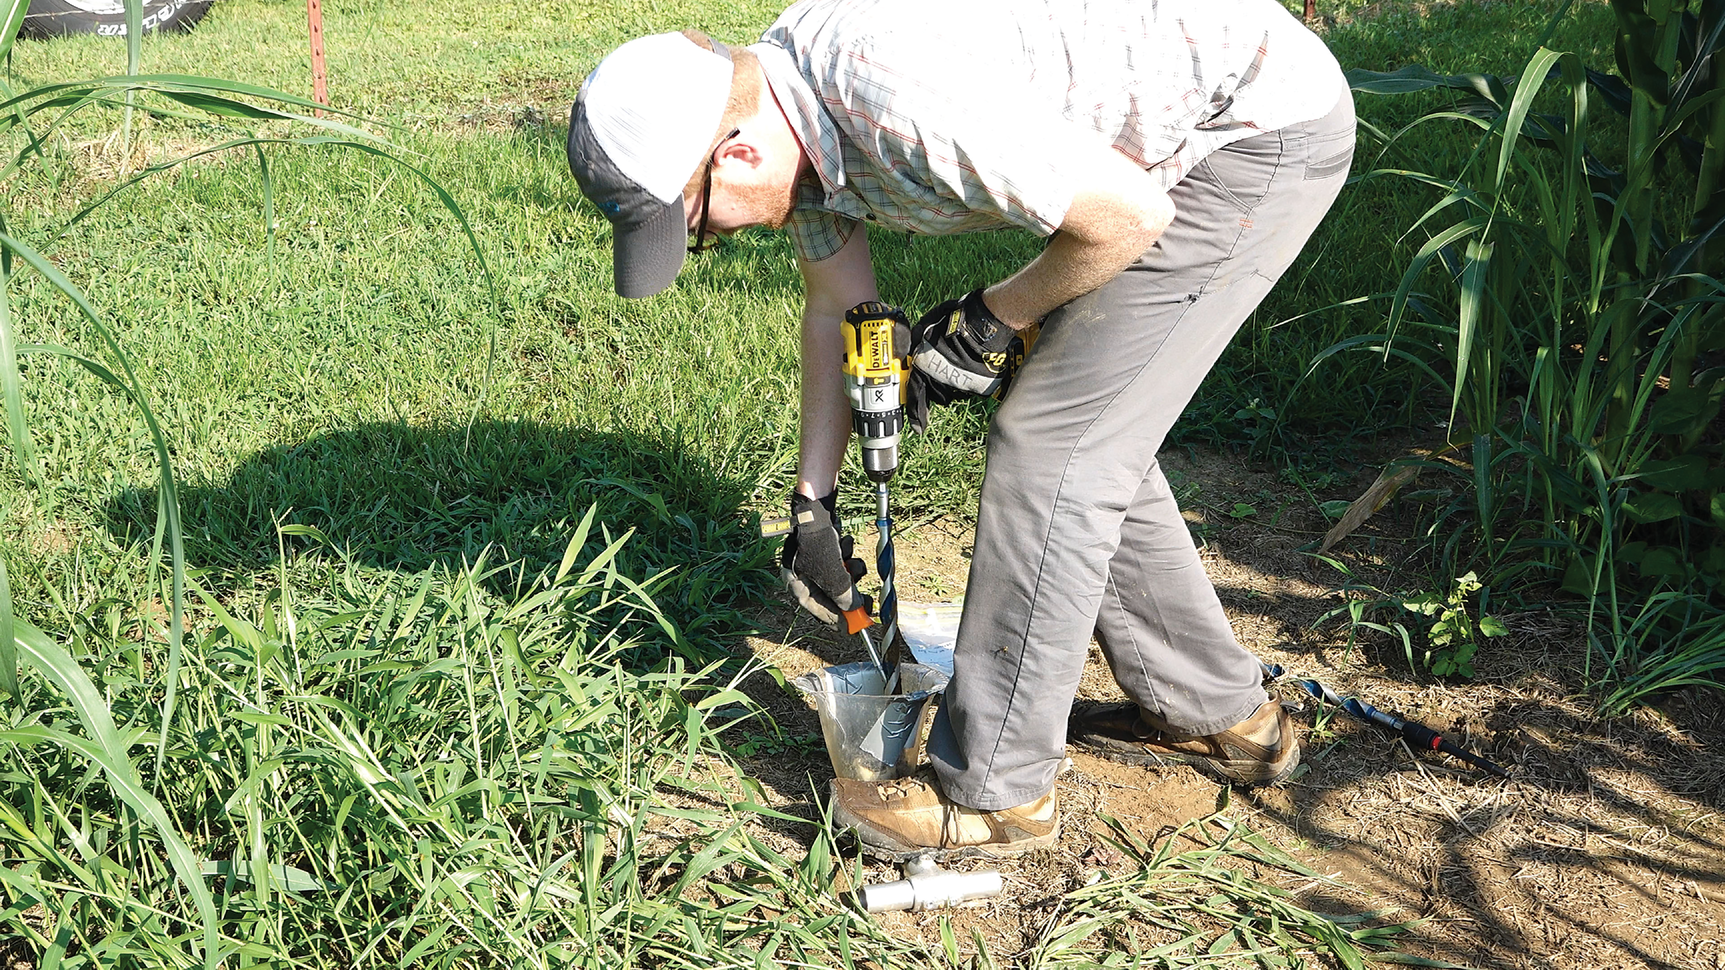
As we work to combat climate change, reliable data on the effects of greenhouse gases in croplands are critical.
Yet a recent study in the Journal of Environmental Quality found a great deal of variation in how scientists measure greenhouse gas fluxes in these systems.
The study examines the factors driving these discrepancies and proposes a simple way to make the methodologies more transparent in the literature. Researchers and other stakeholders should also consider developing measurement protocols for better “apples-to-apples” comparisons in the future.
Mark Liebig, a research soil scientist with the USDA‐ARS, has spent much of his career measuring greenhouse gas (GHG) emissions in crop systems. For more than two decades, he has been involved with USDA‐ARS’s GRACEnet program, which included long‐term field studies at 33 USDA sites, such as Liebig’s in Mandan, ND. The program’s goal was to compare how net GHG, carbon sequestration, crop/forage yields, and other parameters vary under different management systems. Early on, the collaborators laid the groundwork by developing standardized protocols for these measurements. Their efforts resulted in dozens of publications, including a book co‐edited by Liebig.
Getting like‐minded scientists on the same research team to agree on a set of protocols is one thing. But getting a much wider set of stakeholders with varying funds, time, cropping systems, and interests to do that is another bushel of corn entirely.

“The thought of getting scientists to agree on protocols—that is a very tough, tall order,” says Liebig an SSSA Fellow and member (ASA and SSSA). “I’m not certain that’s even possible when you consider the broad range of resources that we all have to work with.”
Bringing more consistency, or at least transparency, to how GHG fluxes are measured and reported for croplands is increasingly important, given the growth in carbon markets and global goals for reducing GHG emissions. After too many hours spent trying to compare apples‐and‐oranges data from scientific papers, Liebig decided to conduct a review of the array of methods used to measure key variables. In a recent Journal of Environmental Quality (JEQ) article (https://doi.org/10.1002/jeq2.20467), he and his co‐authors revealed the variability in how scientists measure and report GHG fluxes in croplands. At a time when the need for and scrutiny of climate change data has never been greater, the paper underscores how the status quo allows for significantly different results among scientists seeking to measure the same thing. This can make contextualizing that data and conducting meta‐analyses difficult.
Liebig and his colleagues argue there must be a better way. They hope their paper, part of a special virtual issue on climate change (https://bit.ly/climate‐change‐issue) featuring research from across the Societies’ journals, will convince stakeholders, as a first step, to talk about the issue. “We felt there needed to be a conversation about this topic,” Liebig says.
Methodological Mélange
To better understand how different scientists assess GHG flux in crop systems, Liebig and his colleagues gathered nearly 2,000 papers. They winnowed that pile down to 122 that focused specifically on upland crops, most published since 2010, and scrutinized them more closely. They often had to rummage through the reference materials to find exactly how measurements were taken. They found considerable variations in methods used and in frequency and duration of measurements. They even found cases where standard measurements were passed over entirely.
For starters, the team catalogued how the papers calculated soil carbon stocks. They found that scientists probed the soil at depths ranging from 5 to 122 cm.
“I can just about guarantee you that the story is going to be different based on what depth you choose,” Liebig says; it could even make the difference between categorizing the system as a GHG sink or source.
The time between soil carbon stock samplings also ranged considerably, from under one year to 22 years. Research teams used different approaches to the calculations, too: Volumetric/fixed‐depth was the most common, with equivalent soil mass and gravimetric/fixed‐depth trailing, in that order, behind.
The approaches to calculating soil–atmosphere gas flux were similarly diverse. While about half the studies measured flux over the whole year, about 40% measured it only during the growing season. The later timing can, according to the paper, skew the impact of nitrous oxide flux on GHG balance. The frequency of sampling can also affect results.
For the most part, the variations did not surprise Liebig. He was, however, taken aback by what they learned about measurements of carbon balance between the systems and the atmosphere. When co‐author Emma Bergh, then a USDA lab technician, shared the initial results with Liebig, he saw that roughly a third of the papers calculated this using change in soil carbon stocks over time while another third relied on soil respiration. But a quarter of the papers did not consider carbon balance at all.
“I remember when Emma shared that with me, it was like, ‘What did you say? Is this table right? Are there really 32 papers out of 122 that did not account for carbon balance in their estimate’” of GHG flux?
The moment drove home to Liebig the importance of their study. “This is why we’re putting together this paper,” he says, “because this is something that needs to be conveyed.”
Measuring for the Carbon Market
The fast‐evolving voluntary carbon markets have had to grapple with the same measurement questions as academics. Brian Bartle, senior manager of partner enablement at Indigo Ag, agrees that transparency and clarity are key in both worlds. His company designs and manages sustainability programs that help farmers earn income through the carbon market by adopting GHG‐curbing practices.
“If it’s not verifiable, and if you truly can’t tie it back to a sound measurement approach, then you’re at risk of jeopardizing the market,” he says.
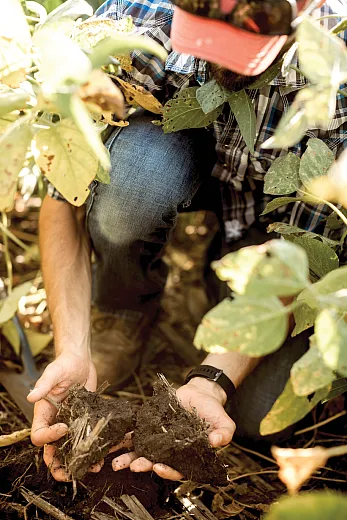
Assessing the effects of different greenhouse gases is a challenge no matter who is doing the measuring: Identical amounts of methane (CH4), nitrous oxide (N2O), and carbon dioxide (CO2) have vastly different impacts on the environment. So scientists created a unit called global warming potential (GWP) to compare them. The larger the GWP, the more that gas warms the earth over a certain time period. The GWP of CO2, the reference gas, is 1. The Intergovernmental Panel on Climate Change’s most recent GWP values for methane and nitrous oxide are 29.8 and 273, respectively, and are reevaluated periodically. Scientists measuring GHG fluxes in a system can thus determine and compare their combined impact: If a system produces 1 metric ton of CH4 and 3 metric tons of CO2, for example, that CH4 value will be multiplied by its GWP of 29.8 to generate a CO2 equivalent value (or CO2e), which can then be added to the 3 metric tons of CO2. This value could then be compared, for example, to the value predicted in that same system after a change in land management. Using CO2e allows all GHG to be factored into a carbon credit, which represents 1 ton of CO2 removed from the atmosphere.
Transparency about the original measurements used to calculate GHG fluxes future‐proofs that information, Bartle says, allowing other researchers to use them in subsequent years, even as GWP values, protocols, and scholarship evolve. “It’s important for scientific research to report the fundamental units that they are measuring (whether that’s CO2, CH4, N2O, etc.),” he explains, “and clearly state any conversions that are done to report in CO2e.”
To make sure their own calculations are correct, Indigo Ag works with a carbon offset registry, Climate Action Reserve (CAR). With input from Indigo Ag and other stakeholders, the registry developed protocols for measuring and reporting GHG fluxes, Bartle says. That ensures the quality of their carbon credits, which compete with credits generated by other sectors, such as forests or carbon capture technologies.
“We need to make sure, for this market to truly flourish, that it’s not perceived as a lower quality,” Bartle says. “The registry is a major tool in this … It’s somebody else coming in and making sure our homework is correct, we’re being accurate, and that our program is truly making a positive environmental impact.”
For example, CAR developed a Soil Enrichment Protocol, also available to other programs, that provides guidance on how to quantify, monitor, report, and verify agricultural practices that enhance carbon storage in soils. Included are guidelines on soil organic carbon (SOC) sampling and testing that, among other things, specify that soil‐sampling depths should be at least 30 cm, and ideally 1 m. In Liebig’s study, many SOC measurements did not meet that threshold.
This may be where the scientific community could take a page from carbon markets, Liebig notes: Details on methodologies aren’t just academic. “It’s important that what we’re talking about is somehow comparable,” he says. “And if it’s not, then we need to provide context to those values. And that’s all that we’re hoping to say with this, given the range of methods that were used.”
Constrained by Resources
Liebig is quick to clarify that he’s not judging anyone’s science. The 122 reviewed studies look at a variety of agricultural systems, and he’s not advocating a “one‐size‐fits‐all” approach to GHG flux estimates. And many researchers are constrained by funds and time, limiting their choice of methodologies and techniques.
“They take a lot of resources to pull off,” Liebig says of the estimates, “but not everybody has the same resources. Some people have the best system, and they can do all kinds of things using the latest technology. Others have to get by with other methods that are still good—they’re solid—but they’re not top of the line.”
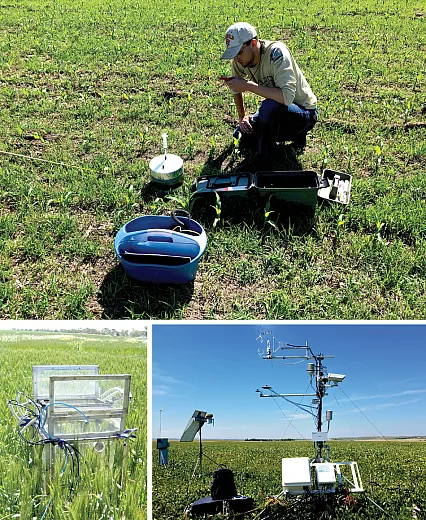
In the case of soil‐atmosphere gas flux calculations, for example, scientists with big budgets have access to state‐of‐the‐art, micrometeorological systems that continuously detect fluxes into or out of the ground over large fields in real time. But these instruments can cost hundreds of thousands of dollars, putting them out of reach for most scientists (including Liebig), who must instead rely on a less costly approach: Physically collecting measurements from static chambers positioned across a study site. Because this is labor intensive, measurements are collected less frequently than with fancier systems.
“It’s not bad, but it takes people, and it’s a fair bit of work,” Liebig says. “On the flip side, it’s great exercise. I can attest that going from one chamber to another, when you have a very short period of time to get there, is a great way to stay in shape.”
When they were collecting data for this study, Liebig and Bergh did a different kind of workout: wading through the fine print of the papers for the details on the measurements. Making this information more accessible and transparent would go a very long way, Liebig argues, to clarifying the science. He proposes that authors include a simple, one‐page form in their papers (he provides a suggested template in the JEQ article) outlining their methodologies. “It’s intended to be just a place to start the discussion,” he says.
Though a much greater challenge, developing protocols for these measurements should also be on the table. “I think some commonality in how we’re going to do our measurements just makes sense,” Liebig says. Such a step would require gathering all the stakeholders at that table, including the researchers making the assessments, the modelers using that data, farmers, policymakers, regulatory agencies, and carbon market companies.
“We need to get more people in the room to get their feedback as to what they would like to see, what factors they think are essential for contributing to the estimates,” Liebig says.
These stakeholders might consider creating a tiered approach to methodologies. Groups with limited resources could report data at a basic tier, and those with more could report at a higher tier.
“If in fact we had a tiered system that would categorize estimates based upon the rigor and thoroughness of the factors that went into them, then stakeholders might be very interested in that,” Liebig says. “They could rely on certain sites as being gold standard sites off which they can base estimates for whatever climate regulation service they hope to reward.”
In a way, Liebig and his colleagues are trying to tweak the rigid format of scientific papers to make room for the broader narrative. “Each paper has its own story, and you often don’t get to hear about the justification behind some of the choices that are made,” he says. “They just have to report what they have.” Taking some of the guesswork out, he says, would let readers see for themselves.
DIG DEEPER
To find out more about the research, read “Variation in Methodology Obscures Clarity of Cropland Global Warming Potential Estimates,” published in the Journal of Environmental Quality, https://doi.org/10.1002/jeq2.20467.
The article is one of two dozen featured in a special virtual issue, “Advancing Resilient Agricultural Systems: Adapting to and Mitigating Climate Change,” showcasing recent research from many of the journals published by ASA, CSSA, and SSSA. See https://bit.ly/climate‐change‐issue.
Text © . The authors. CC BY-NC-ND 4.0. Except where otherwise noted, images are subject to copyright. Any reuse without express permission from the copyright owner is prohibited.


