Same soil, different answers
Impacts of fertilizer recommendations on forage production
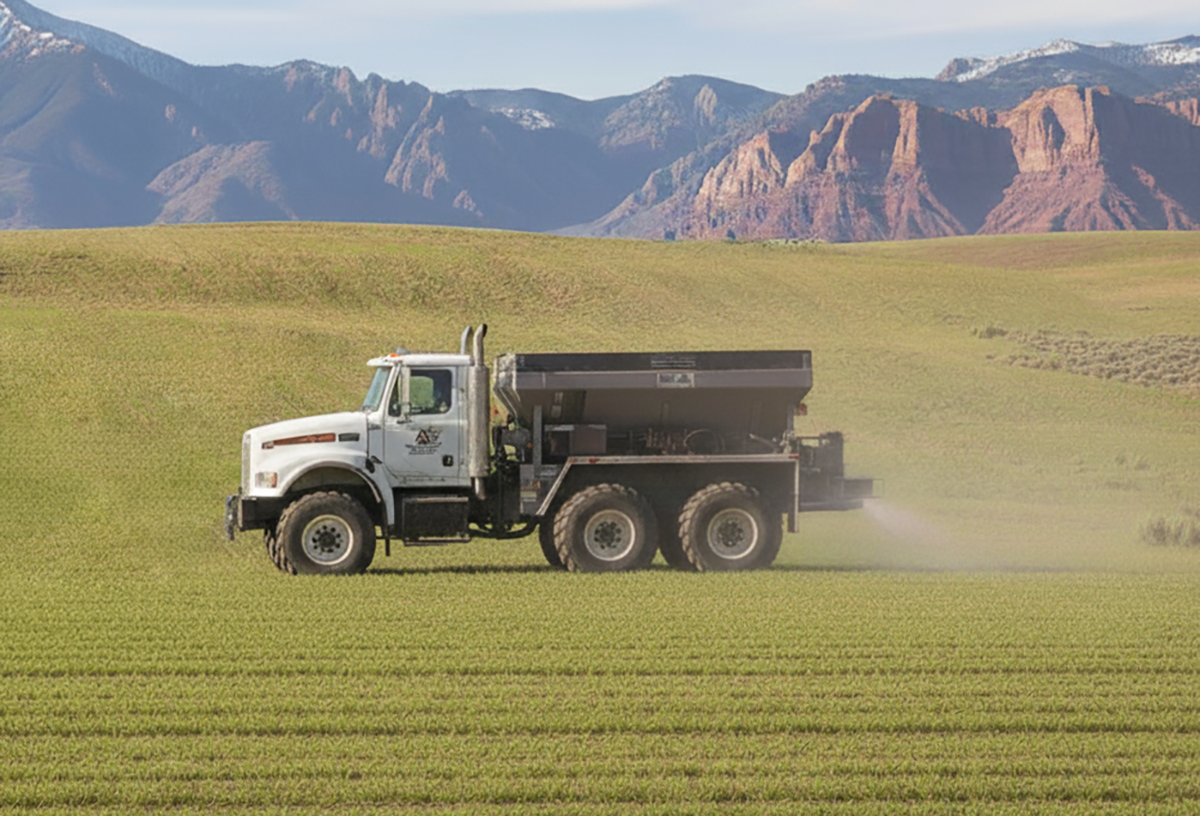

Fertilizers are an important tool for improving yields and quality in crop production. Soil tests are often an important component of fertilizer recommendation calculations, but different soil analysis methods used, interpretations of soil test results, and recommendation philosophies cause fertilizer recommendations for the same crop to vary greatly. Fertilizer recommendations from commercial and university soil-testing labs in Utah forage systems were compared with wide variation found in nutrient rates and costs, driven mainly by differences in recommendation philosophies rather than soil test results. More efficient, science-based recommendations can help growers optimize production while reducing unnecessary expenses and environmental impacts.
This article was prepared as a contribution of the Western Region Nutrient Management Coordinating Committee (WERA-103). Earn 1 CEU in Nutrient Management by reading the article and taking the quiz.
Fertilizers are an important tool for improving yields and quality in crop production with roughly 30–50% of crop yields being attributable to commercial fertilizer nutrient inputs (Stewart et al., 2005). Unfortunately, fertilizer is also one of the highest input costs for many farm operations, and high prices can lead farmers to minimize fertilizer expenditures. Unfortunately, these management changes are often accompanied by reduced yields and profits. Determining fertilizer rates for optimal crop yield and quality that also minimize costs and environmental harm can be difficult, which is why many growers outsource this crop management decision.
There are numerous sources that growers can utilize to determine fertilizer needs with many relying on commercial or public soil-testing labs, crop advisers, fertilizer dealers, or university extension services. Soil tests are often an important component of fertilizer recommendation calculations with more than 7.5 million samples being submitted to soil-testing laboratories across North America for analysis in 2015 (IPNI, 2015). Universities and soil-testing labs provide soil-testing services with the goal of measuring plant-available nutrients in the soil and using this information to formulate site-specific fertilizer recommendations that will optimize or maximize crop yields. Different soil analysis methods used, interpretations of soil test results, and recommendation philosophies cause fertilizer recommendations for the same crop to vary greatly.
What contributes to differences in fertilizer recommendations?
Recommendation philosophies are often driven by nutrient management goals, whether to optimize yield for a crop for one growing season, replace nutrients in the soil taken up by growing crops, or to increase soil nutrient concentrations to where they will not be limiting in future years. The fertilization philosophy used by recommendation sources has a large impact on the resulting fertilizer recommendations and costs. Fertilizer recommendations are sometimes criticized for being too liberal at commercial labs and too conservative at public or university labs. Public and private advisers actively try to avoid or correct nutrient deficiencies to help growers prevent potential yield and profit losses; however, these efforts can sometimes lead to excessive and unprofitable fertilizer recommendations.
Studies conducted over the last 50 years evaluating soil-testing laboratories and comparing fertilizer recommendations have found that recommendation approaches, variations in soil test results among soil-testing laboratories, lab analysis accuracy, and financial gain can all contribute to differences in fertilizer recommendations among public and private sources. Previous studies suggested that comparisons of fertilizer recommendations would help reduce variability of recommendations between private and public fertilizer recommendations (Follett et al., 1987). But recent regional and national surveys evaluating soil-testing procedures and fertilizer recommendation strategies have identified much variation across and among regions, emphasizing the importance of collaboration and standardization where possible (Lyons et al., 2020; Zhang et al., 2021). While there have been some recent multi-state and regional studies and efforts to improve uniformity of analysis procedures and fertilizer recommendations, none of these studies have taken place in the western U.S. or in forage crops.
In the Intermountain West, forage crops are dominant, with more than 80% of crop acreage in Utah being dedicated to forage (hay/haylage and corn for silage/greenchop) in 2022 (NASS, 2024). Comparisons of soil-testing laboratories and fertilizer recommendations within this region and for common crops are necessary for identifying variability that could potentially contribute to fertilizer recommendations that are neither economical nor environmentally conscious.
To address these needs, a study was conducted from 2021–2023 in Utah to evaluate (i) the variability of soil test results and fertilizer recommendations from three commercial and two public labs (Utah State University and University of Idaho) located in the western U.S. for common field crops; (ii) the impacts of these recommendations on crop yield, quality, and economic returns in forage crops; and (iii) how these fertilizer recommendations impact soil test values in field trials over several (one to three) years. With recent efforts to standardize soil analysis methods and fertilizer recommendations within regions, evaluating common fertilizer recommendations is important for refining recommendations and better assisting growers in making science-based decisions about nutrient management.
Comparison of five fertilizer recommendations
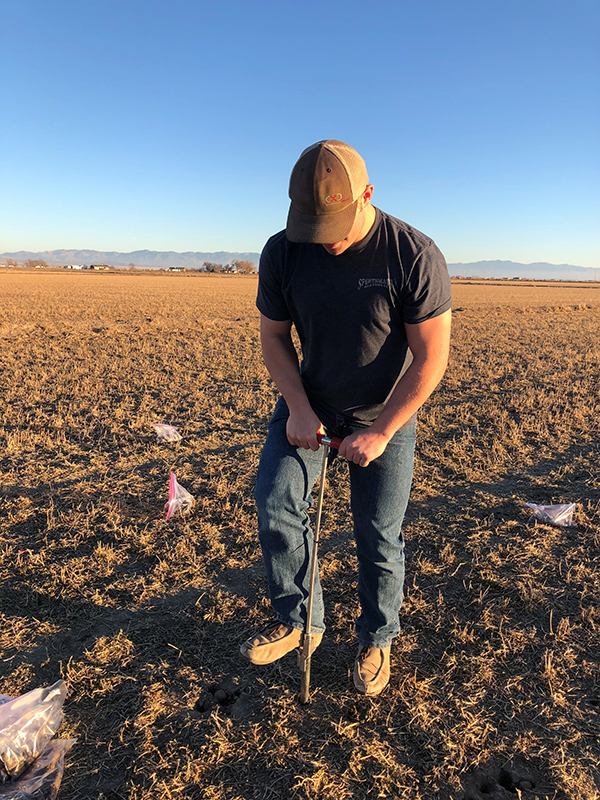
The fertilizer recommendation study was established in 2021 with 12 sites located across the state of Utah in alfalfa, small grains, and silage corn to test and compare fertilizer recommendations from five labs. The commercial labs will be referred to as labs A, B, and C throughout this article for anonymity. A baseline soil sample was collected from 21 prospective fields, split, and sent to multiple labs for analysis. Samples were sent to three commercial labs, and fertilizer guidelines from the two universities were used with the soil test results from one of the labs due to turnaround times for analysis. Each of the labs were given the same crop history and management information, and the resulting soil test results and fertilizer recommendations were compared.
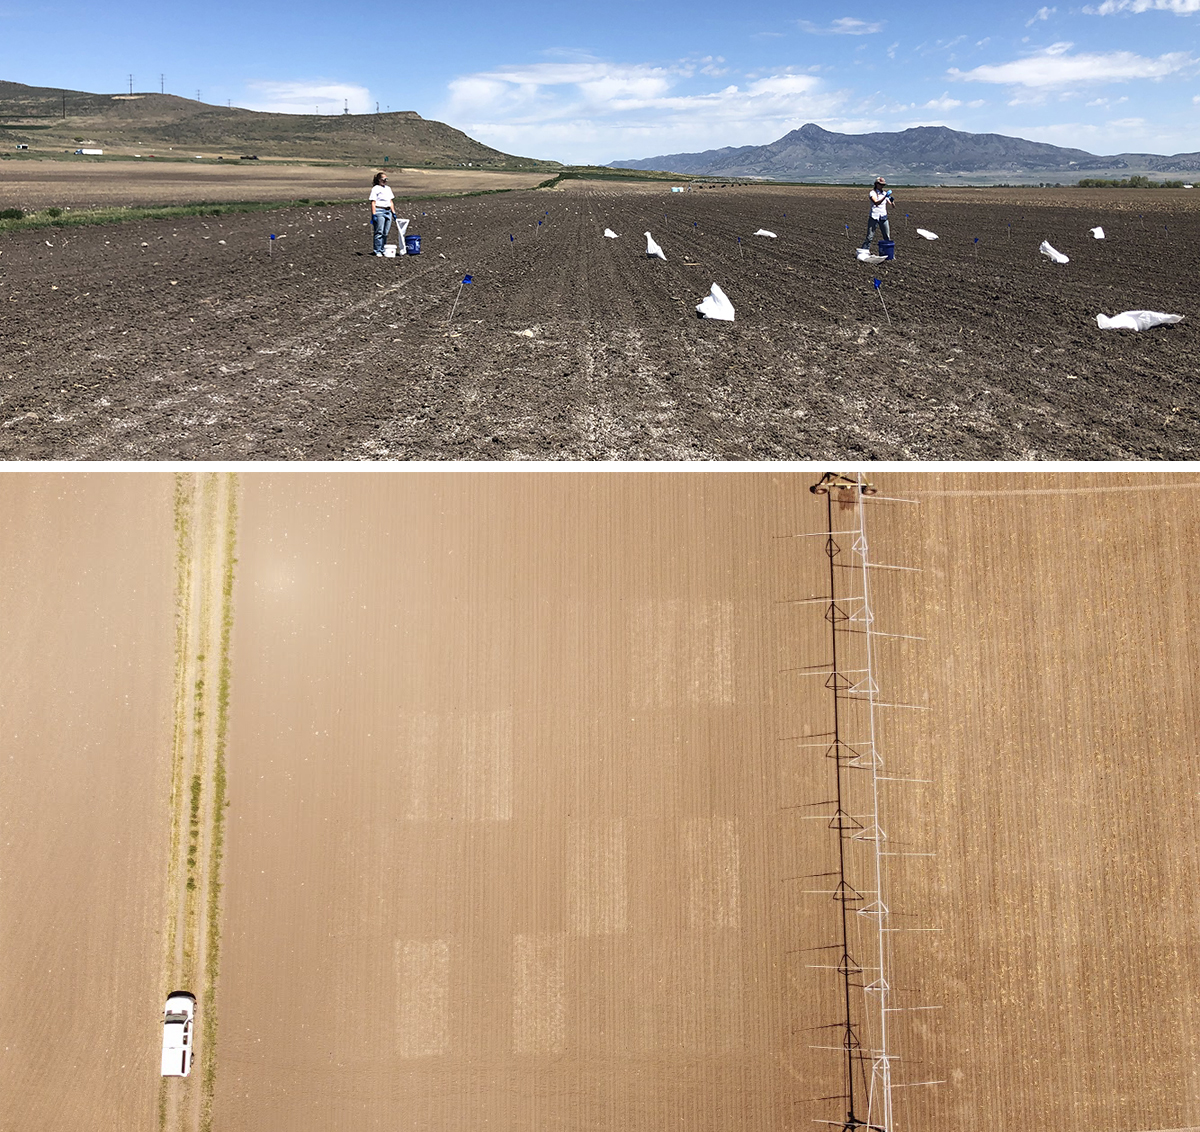
Corresponding macronutrient and micronutrient rates recommended were applied at 12 sites. Four replications of each of the five lab treatments and a nonfertilized control were applied at each site in a randomized complete block design (RCBD). Crop yield and forage quality data were collected from these sites from 2021–2023 to evaluate treatment impacts. Seven of these 12 trials were repeated in 2022, and four of those were repeated in 2023.
Composite soil samples for each treatment were collected and compared each year at repeated sites to identify changes in soil test results due to the fertilizer recommendation treatments applied. For nutrients where excessive rates are often recommended to increase soil nutrient concentrations (phosphorus, potassium, sulfur, and zinc), changes in soil test values were compared with rates applied to determine feasibility of application. Soil test results were also compared with those from the nonfertilized control to determine how the application of various fertilizer rates impacts soil test values over time.
Variation in fertilizer rate recommendations
Fertilizer recommendations from the five laboratories varied greatly, both for types of nutrients and rates recommended. This is likely due to a combination of differences in soil test values (minor influence) and the fertilizer recommendation philosophies (major influence) utilized by each lab. For nutrients such as nitrogen (N), the coefficient of variation (CV) for soil test results was 33% with the same analysis methods being used by all of the labs (Figure 1), but the CV for recommended rates was 118%, indicating that recommendation philosophy had a much larger influence than analysis variability. Some labs recommended N applications on alfalfa sites or high rates on corn or small grains following alfalfa while others recommended no fertilizer or severely reduced rates.
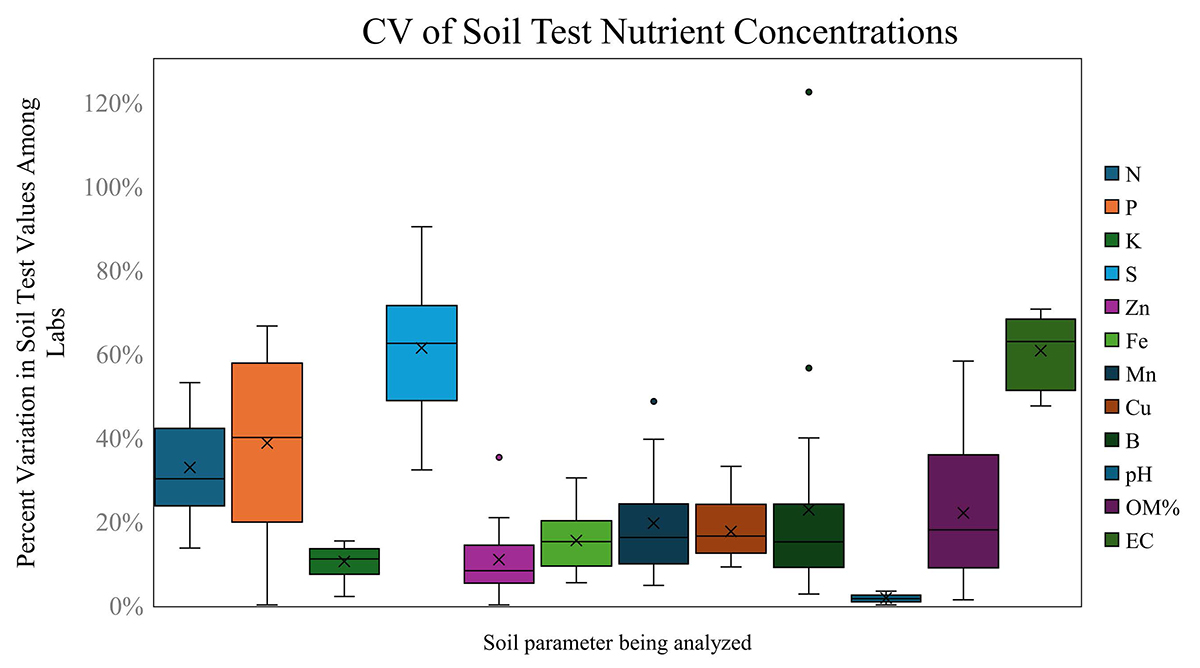
For other macronutrients such as phosphorus, different analysis methods were used, but variation in soil test results was similar (average CV = 39%). The recommended rates varied 68% on average with a difference of 200 lb P2O5/ac between the highest and lowest rates, but some sites had recommendation differences of more than 360 lb P2O5/ac. The commercial labs recommended more nutrients and at much higher rates than the public labs, especially for micronutrients, which resulted in large cost differences among treatments.
Variation in fertilizer costs
Across all sites, the difference between the highest and lowest treatment costs ranged from $215 to $820/ac. The recommendations from some labs were consistently much more expensive than the others with lab C being the highest at 91% of sites (Figure 2). Labs A and C recommended more nutrients and at higher rates than the other treatments, resulting in recommendations that often cost $160–300 more per acre. Differences were larger for alfalfa and corn than small grains, largely due to the differences in N rates recommended.

The university treatments were typically the lowest with Utah State University (USU) recommendations being the least expensive at 14 of the 21 sites where they were evaluated. The differences in nutrients recommended were one of the main drivers of these differences with the main macronutrients (N, P, and K) accounting for an average of 84% of total treatment costs. For the university labs, they accounted for 90 and 92% of fertilizer costs on average for USU and University of Idaho (UOI), respectively. For lab C, this value was only 70%, indicating that micronutrients were a more significant portion of the recommendations, which had a significant impact on overall treatment costs. These differences in costs were not justified by increased yield or quality. Fertilizer treatments had little to no impact at four silage corn and five alfalfa sites, but differences in yield and forage quality were observed at the three small-grain forage sites.
Fertilizer recommendation effects on crop yield and quality
Corn yield was not impacted by fertilizer treatments, but this study did not have a true N control due to the N received through fertigation (on average, fulfilled 23% of required N according to recommendations) because it could not be avoided. Differences between the control and fertilizer treatments may have been observed if N was omitted. Small-grain forage yield was influenced by treatments at all three sites where it was tested with USU recommendations yielding the highest or second highest and increasing yield by 35% compared with the control on average (Figure 3). The nonfertilized control yielded the lowest or second lowest with labs B or C yielding the same. Higher recommended rates did not always result in higher yields with USU having some of the lowest fertilizer rates and often yielding the highest.

Crude protein (CP) was also influenced by treatments with fertilizer treatments increasing CP percent at both sites with multiple years. Lab C, which often recommended the highest fertilizer rates, had the highest CP at 16% and 12% for Sites 1 and 2, respectively. No other quality parameters were significantly impacted (acid detergent fiber, neutral detergent fiber, total digestible nutrients, relative feed value, and relative forage quality).

Alfalfa yield was only impacted at one of five sites with all treatments yielding higher than the nonfertilized control by 0.2 to 0.9 tons per acre dry matter yield (Figure 4). Most alfalfa forage quality parameters were not impacted with only phosphorus and potassium concentrations being increased by treatments where high rates were applied. Fertilizer treatments increased the alfalfa yield at one of five sites, and forage quality was occasionally impacted, but these differences would have had minor to no impact on the market value of the alfalfa.
Fertilizer recommendation impacts on soil test values
When the recommendations were applied in field trials, higher application rates often resulted in increases in soil nutrient concentrations for some nutrients (P, K, S, and Zn), but the ratio of the application rate to changes in nutrient levels varied greatly among sites and treatments. Higher ratios indicate that higher nutrient applications are needed to increase soil nutrient concentrations. There was no consistent pattern for these ratios or how much the soil test values changed as a result of the applied fertilizer rates. It also illustrates which nutrients are more likely to “build up” in the soil. Excessive fertilizer rates are often recommended with the intention of increasing nutrient concentrations within soil, but these data indicate that soil buffering capacity, soil test levels at the time of fertilization, crop removal, and other factors vary greatly and will influence how soil test values change in response to fertilizer. When the cost of fertilizers is included, it was often not financially feasible to build soil nutrient concentrations. It is often more efficient and economical to apply fertilizer to supply the nutrients needed to optimize crop yield for a given year.
Takeaways
Fertilizers are a large input cost for many agricultural operations and can greatly influence resulting profits. Comparison studies like this provide transparency for the possible fertilizer recommendation sources used by growers. While the nonfertilized control yielded similar to fertilized treatments, this does not indicate that fertilizers are not needed for crop production. Rather it indicates that more-efficient fertilizer rates can optimize crop production while minimizing costs and negative environmental impacts and that critical soil test values and corresponding nutrient guidelines may need to be updated. The results of this study demonstrate that growers should be aware when selecting fertilizer recommendations, and opportunities exist for better public–private coordination of science-based recommendations.
References
Follett, R.H., Westfall, D.G., & Croissant, R.L. (1987). Soil test recommendation comparison study. Journal of Agronomic Education, 16, 73–76. https://doi.org/10.2134/jae1987.0073
IPNI. (2015). Soil test levels in North America, 2015. International Plant Nutrition Institute. https://www.researchgate.net/publication/315074855_2015_North_American_Soil_Test_Summary
Lyons, S. E., Osmond, D. L., Slaton, N. A., Spargo, J. T., Kleinman, P. J., Arthur, D. K., & McGrath, J. M. (2020). FRST: A national soil testing database to improve fertility recommendations. Agricultural & Environmental Letters, 5(1). https://doi.org/10.1002/ael2.20008
NASS. (2024). 2022 State agriculture overview—Utah quick stats. USDA National Agricultural Statistics Service. https://www.nass.usda.gov/Quick_Stats/Ag_Overview/stateOverview.php?state=UTAH
Stewart, W. M., Dibb, D. W., Johnston, A. E., & Smyth, T. J. (2005). The contribution of commercial fertilizer nutrients to food production. Agronomy Journal, 97, 1–6. https://doi.org/10.2134/agronj2005.0001
Zhang, H., Antonangelo J., Grove, J., Osmond, D., Slaton, N. A., Alford, S., … & Wang, J. (2021). Variation in soil-test-based phosphorus and potassium rate recommendations across the southern USA. Soil Science Society of America Journal, 85, 975–988. https://doi.org/10.1002/saj2.20280
Self-study CEU quiz
Earn 1 CEU in Nutrient Management by taking the quiz for the article. For your convenience, the quiz is printed below. The CEU can be purchased individually, or you can access as part of your Online Classroom Subscription.
1. What factor contributed the most to the large variation in fertilizer recommendations among soil-testing laboratories in the study?
a. Differences in weather conditions during sampling.
b. Variability in soil test values across labs.
c. Sampling errors made by growers.
d. Differences in fertilizer recommendation philosophies.
2. How did fertilizer recommendation philosophies influence costs in this study?
a. All labs provided similar nutrient rates, so costs were nearly identical.
b. University labs recommended more nutrients, leading to higher costs.
c. Commercial labs often recommended higher nutrient rates and more micronutrients, raising costs.
d. Fertilizer dealers discounted costs to match university recommendations.
3. Which crop showed the most consistent yield response to fertilizer recommendations in the Utah field trials?
a. Small grains, which showed yield improvements with fertilizer treatments.
b. Corn, which increased yield at all sites.
c. Alfalfa, which consistently responded to fertilizer across all sites.
d. None of the above.
4. What did the study suggest about applying fertilizer to build soil nutrient concentrations?
a. It is always the most profitable strategy for growers.
b. It consistently improves soil nutrient values and crop yield.
c. It is often financially inefficient and less effective than meeting annual crop needs.
d. It should be the primary goal of all soil-testing laboratories.
5. Based on the study’s findings, which two considerations are most important for growers when selecting fertilizer recommendations?
a. The color of fertilizer products and ease of application.
b. Cost-effectiveness and science-based decision-making.
c. Weather forecasts and fertilizer dealer location.
d. Brand reputation and packaging size.
6. With how variable fertilizer recommendations can be depending on the source, soil testing is NOT an effective tool for determining crop fertility needs.
a. True.
b. False.
7. What factors influence how soil test values may change with the application of fertilizer?
a. Initial soil test value.
b. Soil buffering capacity and characteristics.
c. Fertilizer rate applied.
d. All of the above.
8. It is possible to apply fertilizer rates to increase soil test values by a specific amount?
a. True.
b. False.
9. What factors contributed to the lack of fertilizer response in corn in this study?
a. Corn does not often require fertilizer for productive growth.
b. High levels of soil nutrients meant that very low fertilizer rates were recommended.
c. Fertilizer application methods were not effective for supplying crops with necessary nutrients.
d. The corn sites in this study received N through fertigation meaning there was not a true nonfertilized control.
10. For alfalfa, which of the following forage quality parameters were impacted by the fertilizer treatments?
a. Acid detergent fiber and neutral detergent fiber.
b. Total digestible nutrients and relative forage quality.
c. Relative feed value.
d. None of the above.
Text © . The authors. CC BY-NC-ND 4.0. Except where otherwise noted, images are subject to copyright. Any reuse without express permission from the copyright owner is prohibited.


