Nitrogen Uptake Efficiency: A Measurement for Improving Nutrient Management in Wheat


Nutrient management, and more specifically nitrogen management, is important for the bottom line and is an integral part of soil health. Conducting a post-harvest assessment of yield, grain protein levels, and nutrient uptake efficiency is a vital part of an effective nutrient management plan. This article demonstrates the use of a tool to do this. Earn 0.5 CEUs in Nutrient Management by reading this article and taking the quiz.

Wheat harvest across the Pacific Northwest is often referred to as the “end of the season” with farmers calculating yields and assessing quality grades. It is also an important time for farmers to assess their nutrient management program. Nutrient management is essential to the economical production of high‐yielding, high quality wheat and to preserving soil, water, and air quality. More specifically, nitrogen is a major factor, if not the single largest factor, in profitable wheat production in the Pacific Northwest.
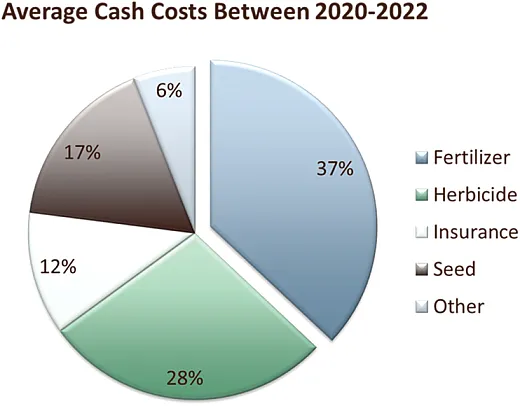
Profit is the revenue remaining after all costs are paid. Revenue is a function of wheat yield, quality, and market price. Nitrogen has a significant impact on yield and quality, promoting tillers, enabling photosynthesis, and building grain protein. Fertilizer, of which nitrogen in a large portion of, is a major input cash cost associated with the production of wheat on an annual basis. At the Washington State University (WSU) Wilke Research and Extension Farm, fertilizer represents 37% of the total cash costs and is the single largest cost annually (Figure 1).
Nutrient management is also important given that fertilizer is a global commodity, and price can be wildly impacted by world events like the war in Ukraine, natural gas prices, international shipping, and world supply‐and‐demand requirements. This was reflected in the 2021–2022 crop year where fertilizer prices spiked. At the WSU Wilke Research and Extension Farm, spring fertilizer prices/unit were 140% greater in the spring of 2022 compared with the spring of 2021. This significant increase in fertilizer costs increases risk for wheat farmers and is mostly due to factors that they have very little control over.
Soil health is the continued capacity of soil to function as a vital living ecosystem that sustains plants, animals, and humans (USDA‐NRCS, 2023). Filtering, buffering, and nutrient cycles are essential functions of healthy soils. Soil pH is an important soil health indicator and is a concern across the wheat‐producing region of the Pacific Northwest. Use of nitrogen‐based fertilizers has enhanced the rate of soil acidification across the region (McFarland et. al., 2015). Improper nutrient management may also promote nitrogen leaching, which further increases soil acidity as less nitrate is taken up, causing less plant release of basic anions (OH‐ and HCO3‐) to maintain a neutral charge in roots (Jones & Engel, 2017).
Now that we have established that nutrient management is extremely important for wheat yield, farm profitability, and soil health, let’s discuss what it entails. As the term implies, nutrient management includes actions such as soil sampling to monitor nutrient levels and adjust application rates as needed for a given wheat crop. Conducting a post‐harvest assessment of yield, grain protein levels, and nutrient uptake efficiency is also a vital part of an effective nutrient management plan, and it’s easy to calculate with the help of the Post‐Harvest Nitrogen Use Efficiency Calculator housed on the WSU Wheat and Small Grains Website (http://smallgrains.wsu.edu). If you don’t measure it, you can’t manage it.
Post‐Harvest Nitrogen Use Efficiency Calculator

The first part of the calculator asks for information regarding the field for accurate record keeping over time, and one can supply as much or little detail as needed (Figure 2). “Crop” is the only input field that needs to be completed for the calculator and is a dropdown menu.
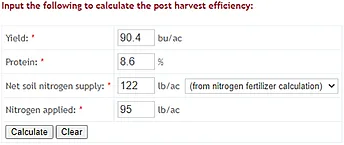
The second part of the calculator is input needed to calculate post‐harvest efficiency (Figure 3). The first two input fields are yield and grain protein. Prior to harvest, growers need to work with their grain co‐ops to assure protein is provided on their grade sheets or independent samples are collected, so protein data can be determined post‐harvest. Most grain co‐ops have protein analyzers. The third and fourth input fields focus on nitrogen availability. Net soil nitrogen supply can be provided through a traditional soil sample report, or the value can be calculated using the Nitrogen Calculator, which is also available on the Small Grains Website. This calculator uses your soil sample data along with previous crop yield and cropping system to generate a net soil nitrogen supply value. Nitrogen applied should be a combination of bulk, seed applied, and topdress nitrogen applications, including those applied with herbicides.


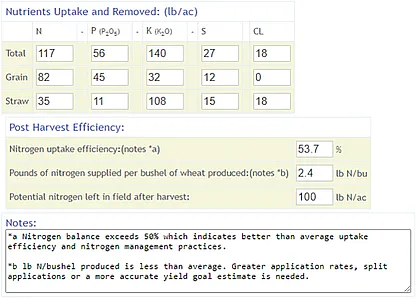
The third part of the calculator is the output (Figure 4). The nutrient uptake and removal (lb/ac) chart has a breakdown on the total nutrient uptake into the wheat plant in the grain and the straw. If the straw is not baled or burned, these nutrients do not leave the field but may or may not be immediately available for the following crop. Note that P and K are expressed as P2O5 and K2O. The post‐harvest efficiency portion has percent nitrogen uptake efficiency (NUE), pounds of nitrogen supplied per bushel of wheat production, and potential nitrogen left in the field after harvest. The notes provide a brief analysis focused on NUE and pounds of nitrogen supplied per bushel of production.
What Does It Mean?
The first thing that stands out in this example from Field 4 at the WSU Wilke Research and Extension Farm is the protein on this winter wheat crop was only 8.6%; thus, maximum yield was not reached. In soft white winter wheat (SWWW), maximum yield is often achieved when grain protein is closer to 10%. Perhaps some other nutrient or another management practice like herbicide timing may be limiting yield because the crop was not limited because of available nitrogen.
Let’s now focus on the potential nitrogen left in the field. In this example, it’s estimating that 100 lb N/ac should be available for the following crop. This number is generated by taking how much total N was available (122+95) and subtracting it from the total nitrogen taken up by the winter wheat crop (117). One of the things to consider is when your grain left the field, only 82 lb N/ac was removed and 35 lb N/ac stayed within the crop residues, assuming no straw was baled, removed, or burned. One can anticipate this field having between 100 and 135 lb N/ac available in the spring when it is soil sampled. If this is not the case, you need to examine if you had conditions favorable for nitrogen loss such as leaching, volatilization, or denitrification or take a closer look at your soil sampling methods to assure you are taking a good representative sample.
Farmers are always asking and concerned about how many pounds of nitrogen need to be supplied per bushel of wheat production. This is one value farmers can assess for their own farm and figure out how many pounds of nitrogen need to be supplied to produce a bushel of grain under their management system. Traditionally, SWWW required 2.7 lb N/bu produced give or take 0.2 lb N/bu (Koenig, 2005). In this example, the SWWW crop utilized 2.4 lb N/bu produced and is less than expected. The note (b) in Figure 4 states that greater application rates, split applications, or a more accurate yield goal estimate is needed. Like the protein comments above, perhaps some other nutrient or another management practice maybe limiting yield because the crop was probably not limited because of available nitrogen.
Let’s now focus on NUE, and in this Field 4 example, it averaged 53.7%. In our example, nitrogen balance exceeds 50%, which indicates better‐than‐average uptake efficiency and nitrogen management practices. Given what we know about grain protein, pounds of N per bushel, and potential remaining N in relationship to NUE, we have little to correct on our variable‐rate N maps or soil‐sampling protocol. The focus should be on other nutrients and management decisions moving forward to see if we can further improve NUE.
What if your NUE number is less than 50%? You need to closely examine the reason. Was it weather related and like other fields across the farm? This can be corrected with more realistic yield goals moving forward. This was the case at the WSU Wilke Research and Extension Farm with the 2021 crop year where SWWW NUE was 33 and 36% and soft white spring wheat ranged between 21 and 23% across three different fields. Yes, it’s disappointing, but with percentages this low, it also meant there should be greater residual nitrogen remaining in the soil available for the 2022 crop year, which should be reflected in soil sample data. If this is not the case, you again need to examine if you had conditions favorable for nitrogen loss such as leaching, volatilization, or denitrification. If these conditions are not present, you should re‐evaluate your nutrient management program.
If your NUE number in a given field is lower than other fields or is just lower than anticipated, you need to ask why this is the case. If you are not using site‐specific nitrogen application, maybe it’s time to invest in the technology. If you have adopted prescription maps, maybe you need to re‐assess the variable‐rate map or your soil‐sampling program. If you feel you are losing nitrogen in your nutrient management system, maybe you need to examine if nitrogen stabilizers will be beneficial in your system, or maybe you need to focus more on split applications. And once again, the focus here is mostly on nitrogen, but perhaps another nutrient or crop production management system is the yield‐limiting factor.
Conclusion
Nutrient management, and more specifically nitrogen management, is important for the bottom line and is an integral part of soil health. Gathering grain protein and calculating and tracking pounds of nitrogen supplied per bushel of wheat production and NUE are important to monitor and adjust nutrient management over time. It’s also important to remember that N is not the only nutrient needed for profitable wheat production, and this information helps assess whether other nutrients are potentially limiting yield. This is one variable farmers con control, and if you measure it, you can more accurately manage it.
References
Jones, C., & Engel, R. (2017). Soil acidification: Cause, management and research presentation. Montana State University.
Koenig, R.T. (2005). Dryland winter wheat: Eastern Washington nutrient management guide (WSU Publications EB1987E). http://pubs.cahnrs.wsu.edu/publications/wp‐content/uploads/sites/2/publications/eb1987e.pdf
McFarland, C.R., Huggins, D.R., Koenig, R.T. (2015). Soil pH and implications for management: An introduction (WSU Publications FS170E). Washington State University Extension. http://pubs.cahnrs.wsu.edu/publications/wp‐content/uploads/sites/2/publications/FS170E.pdf
USDA‐NRCS. (2023). Soil health. https://www.nrcs.usda.gov/conservation‐basics/natural‐resource‐concerns/soils/soil‐health
Self-Study CEU Quiz
Earn 0.5 CEUs in Nutrient Management by taking the quiz. For your convenience, the quiz is printed below. The CEU can be purchased individually, or you can access as part of your Online Classroom Subscription.
- Improper nutrient management may also promote nitrogen leaching, which increases soil acidity.
- True
- False
- In soft white winter wheat, maximum yield is often achieved when grain protein is close to:
- 4%
- 6%
- 8%
- 10%
- The crop from the example from Field 4 was limited because of available nitrogen.
- True
- False
- How many pounds of nitrogen need to be supplied per bushel of wheat produced?
- 1.2
- 2.7
- 3.5
- 4.3
- In the Field 4 example, in order to further improve NUE, the focus moving forward should be on:
- Variable‐rate N maps
- Soil‐sampling protocol
- Other nutrients and management decisions
- None of the above
Text © . The authors. CC BY-NC-ND 4.0. Except where otherwise noted, images are subject to copyright. Any reuse without express permission from the copyright owner is prohibited.


