The Influence of a Soil Sample Core
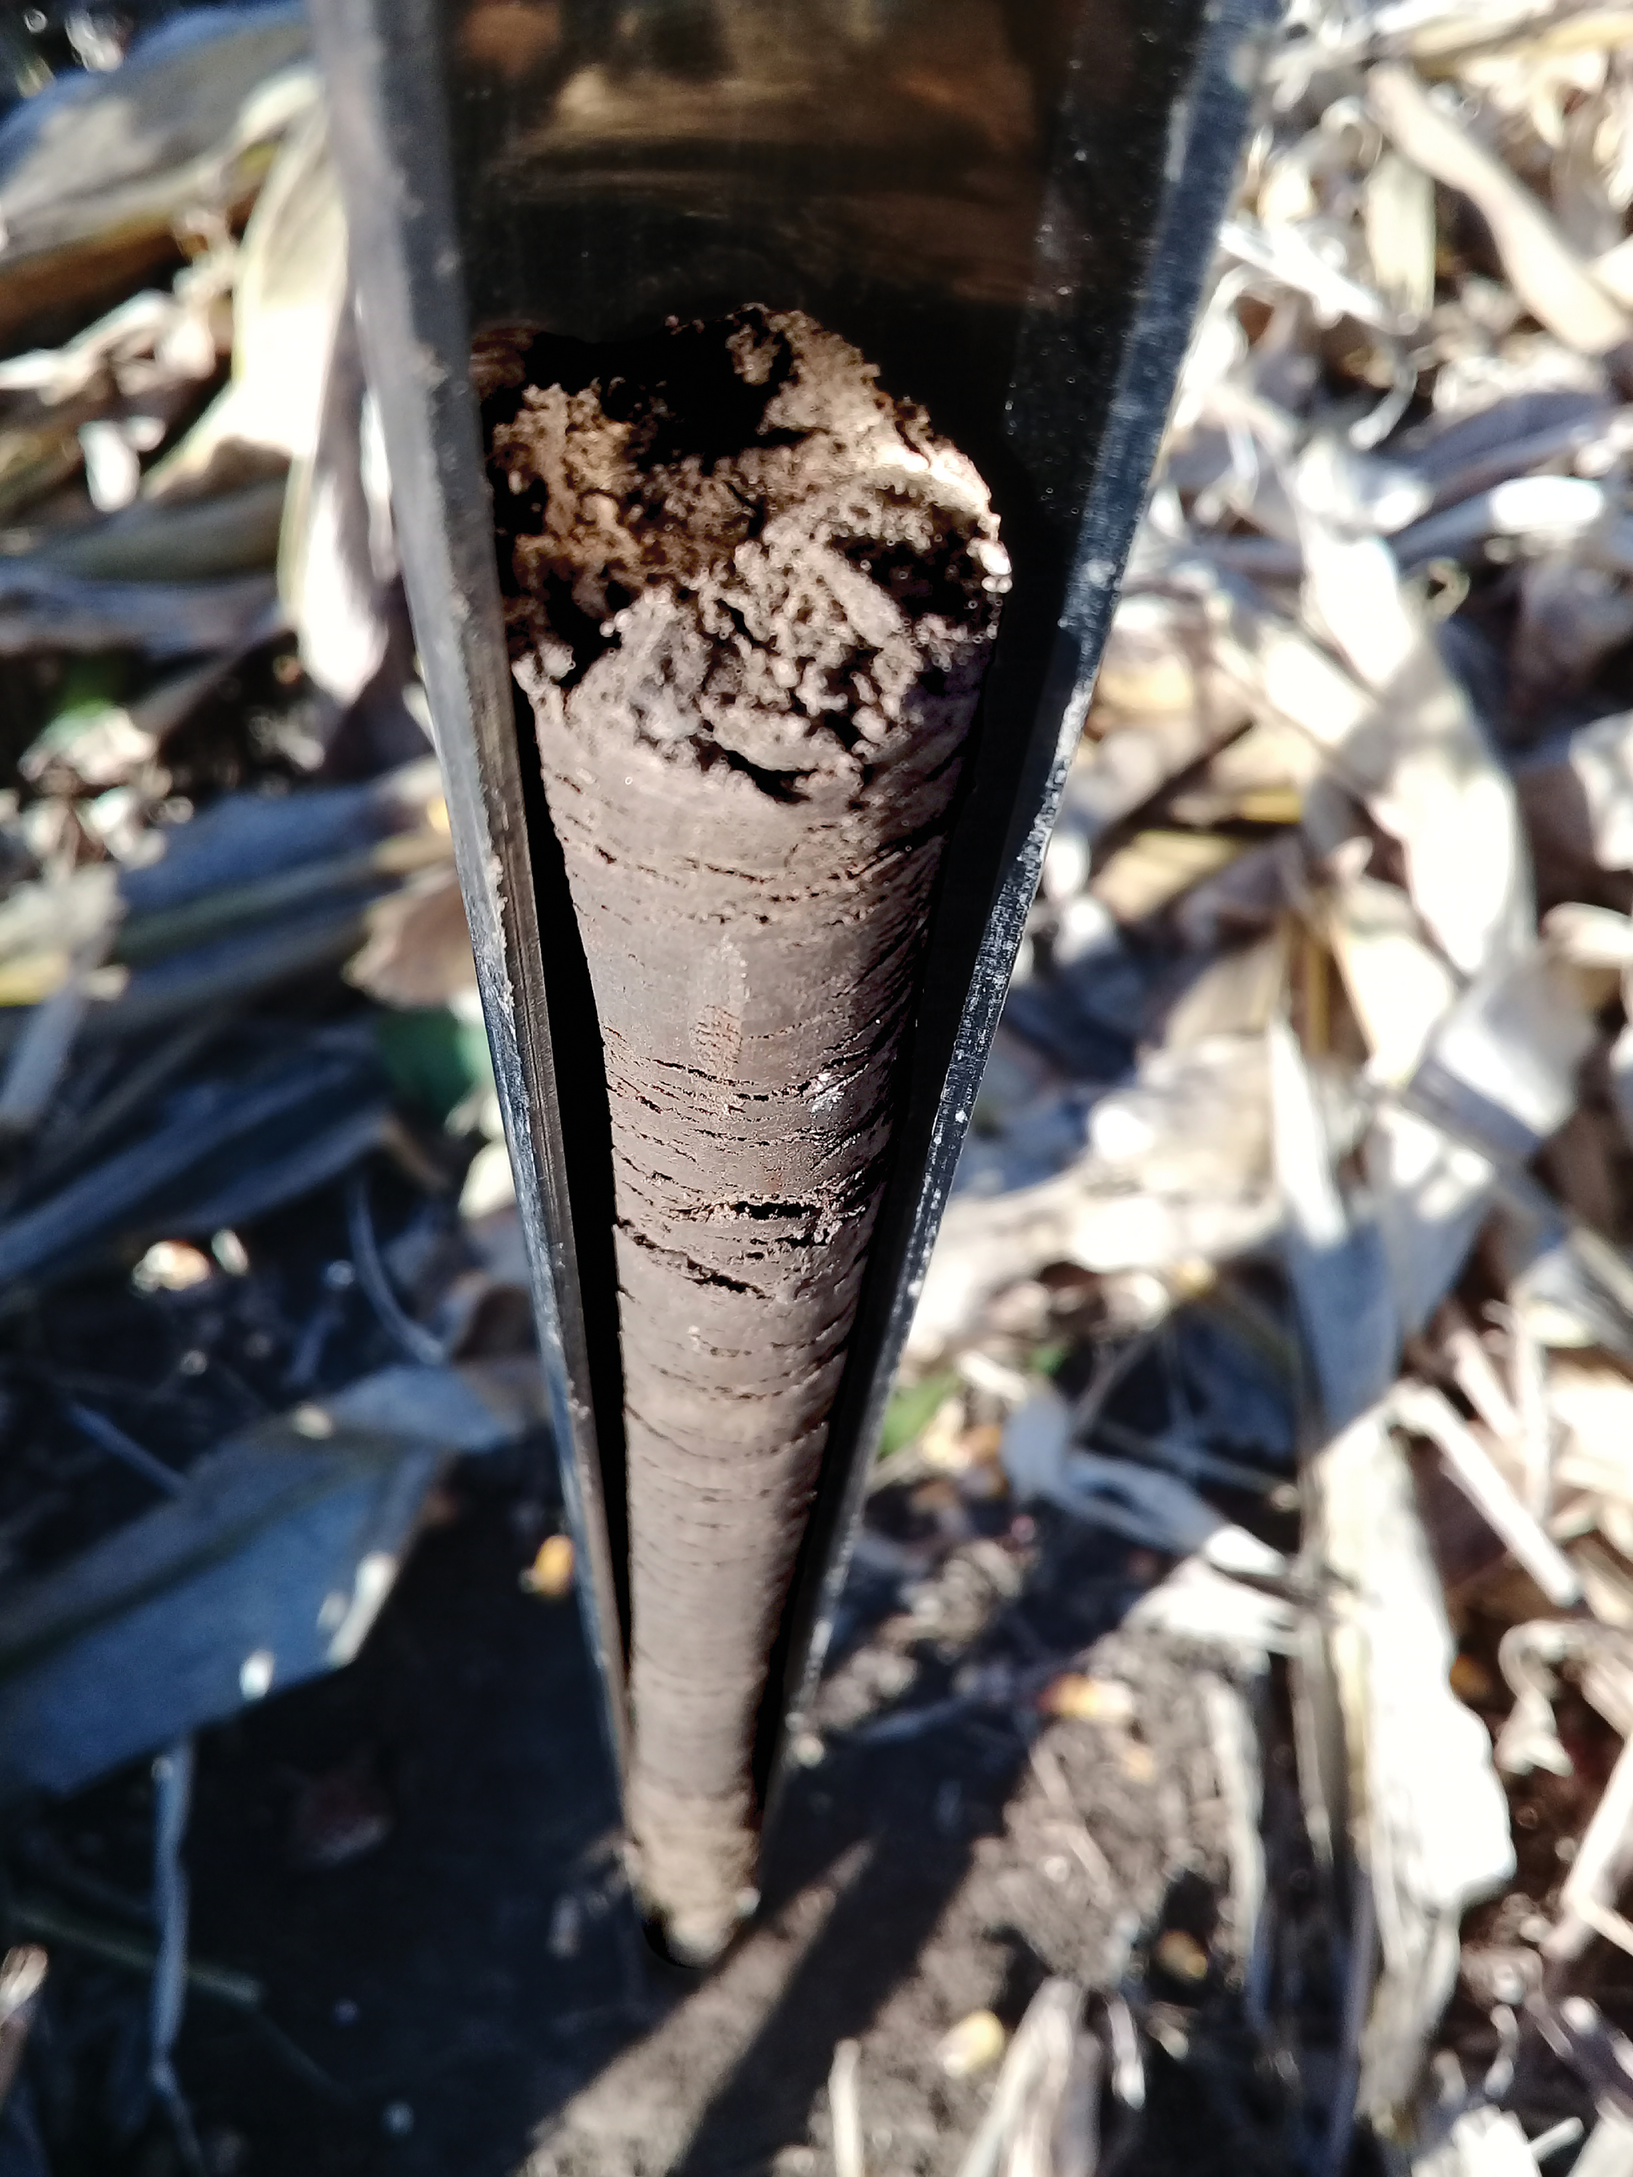

It is critical that we are careful, not casual, when sampling soils. Many dollars of fertilizer decision rest upon a good soil sample. Several years ago, I was curious about the influence of the number of sample cores that comprise a composite soil sample. A review of several soil-sampling publications at the time recommended anywhere from 8 to 20 individual cores should comprise the sample. So I endeavored to look at the statistics behind this suggestion. What I discovered will be discussed in this article. Earn 0.5 CEUs in Soil & Water Management by reading this article and taking the quiz at https://web.sciencesocieties.org/Learning-Center/Courses.
Each acre-foot of soil contains approximately 3.6 million pounds of soil. If one soil sample represented approximately 10 ac, then the sample represents about 36 million pounds of soil. In the laboratory, only 5 g of soil may be used to characterize the phosphorus soil test—a very small amount compared with the 36 million pounds.
Trust me with the math for a minute, and let's put this in another context. This 5 g of soil sample representing 10 ac of ground would be the same as sampling approximately 3 kernels of wheat from a bin holding 10,000 bu of grain—a very small subsample indeed.
Thus, it is critical that we are careful, not casual, when sampling soils. Many dollars of fertilizer decision rest upon a good soil sample.
Several years ago, I was curious about the influence of the number of sample cores that comprise a composite soil sample. A review of several soil-sampling publications at the time recommended anywhere from 8 to 20 individual cores should comprise the sample. So I endeavored to look at the statistics behind this suggestion. Here is what I discovered.
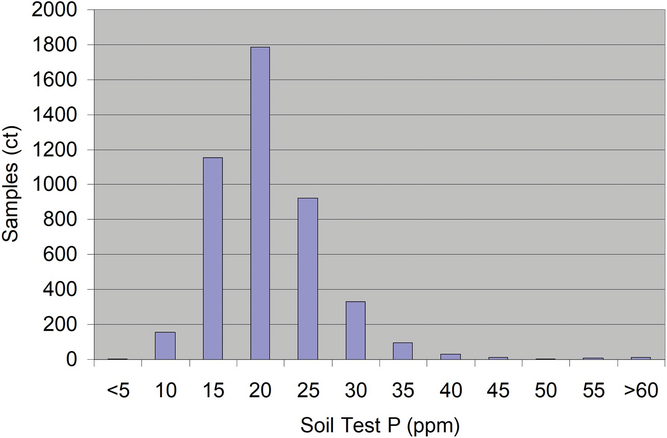
The dataset I used was from the soil test phosphorus results (Olsen-P) of a fairly isolated desert geography where soil samples were collected on 2.5-ac grids from several fields over a period of a few years. I then made the assumption each sample result would represent an individual core. Figure 1 shows the distribution of soil test phosphorus. Approximately 4500 samples are in this dataset, and the distribution appears to be normally distributed.
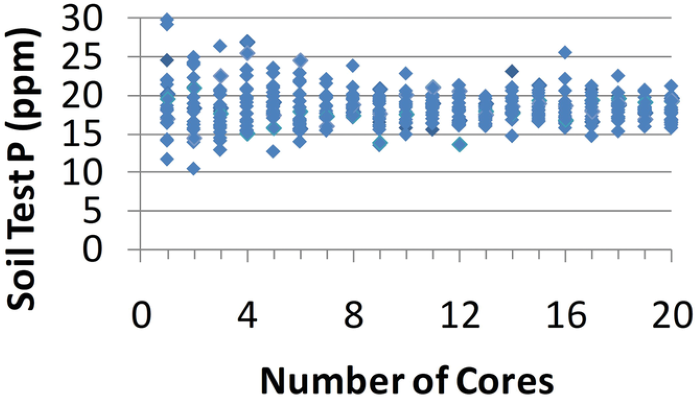
Using functions within Microsoft Excel, I allowed the computer to randomly select 20 samples from the dataset and plotted these as Number of Cores 1. Then I asked the computer to randomly select two samples, averaged these two numbers, and then plotted as Number of Cores 2, repeating that process 19 more times until I had 20 points representing two core composite samples. This process was repeated for 3, 4, 5...20 core composite samples. Figure 2 shows the results of this exercise. You will note as the number of cores increases, the range in variation decreases and gets closer to the true mean of 18.5 ppm (as seen by the red lines.) I pursued this further to see if increasing the number of cores could get the soil test result even closer to the true mean. Figure 3 shows the results of this exercise. While not practical from a soil- sampling standpoint, the data clearly show that variability is substantially reduced and approaches the true mean as the number of cores increases from 20 to 100 core composite samples (as seen by the red lines).
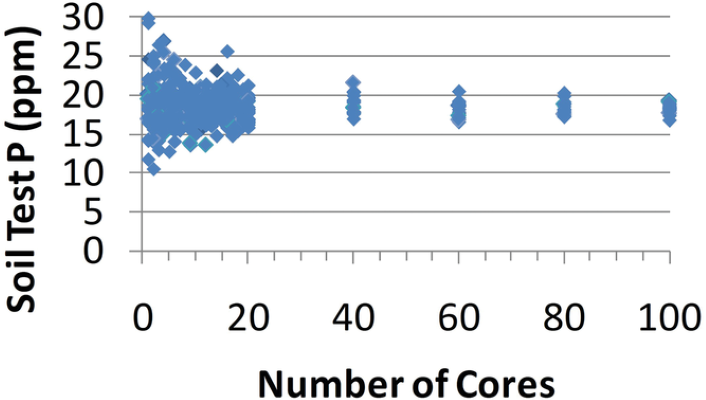
I pursued this further to see if increasing the number of cores could get the soil test result even closer to the true mean. Figure 3 shows the results of this exercise. While not practical from a soil-sampling standpoint, the data clearly show that variability is substantially reduced and approaches the true mean as the number of cores increases from 20 to 100 core composite samples (as seen by the red lines).
Lastly, I looked at the standard deviation of the 20 randomly selected sample results, each with a different number of sample cores ranging from 1 to 100. Figures 4 and 5 show the results of this exercise. As expected, when the number of sample cores representing a composite sample is few (<8 cores), the standard deviation is relatively high (>2.0 StdDev). As the number of cores increases, we observe a corresponding decrease in the standard deviation. Again, while not practical from a soil- sampling standpoint, collecting 100 cores to represent a composite soil samples results in a standard deviation <1.0.
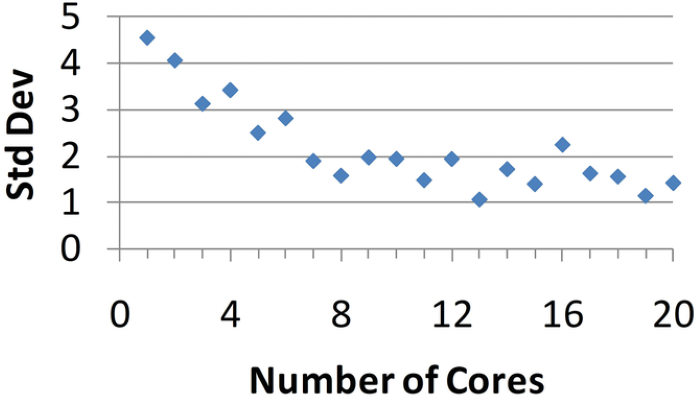
When sampling a normally distributed population, the empirical rule states that 95.4% of the observations will fall within 2.0 standard deviations of the true mean. The statistical analysis and representations shown in this article demonstrate that statistics do indeed work and make sense. Furthermore, these exercises in random sampling demonstrate the rule of thumb for 8--20 cores per composite sample will substantially reduce sampling (<2.0 StdDev) variability and allow the soil sample to approach the true mean of the sampling population, or in this case, the field.
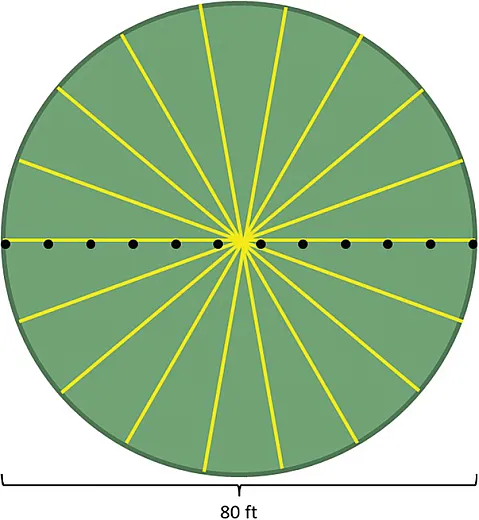
In precision ag, we frequently sample several cores around a GPS point, and use this composite sample to represent this targeted location. This location may be a systematic grid point or it may be selected by various other methods. Often, for practical purposes and efficiency, our sampling method involves taking a few cores in a straight line as we pass through the point. I was interested to know how much variability we would observe in the soil test results depending on which transect we used as we passed through a point.
I established a sampling point in a field and then flagged transects at 0, 20, 40, ... 160 degrees (Figure 6). As I travelled along the transect, I sampled 12 cores at a 0- to 12-inch depth. These cores were composited as a sample and submitted to the laboratory for analysis. Table 1 shows the results for several nutrients. In this example, the standard deviation for all transects of the nutrient soil test results, with the exception of potassium, was less than 1. Potassium exhibited the most variation (48--58 ppm). The potassium soil test value in this field is exceptionally low, and from a practical agronomy standpoint, whether the soil test value was 48 or 58 ppm, it likely would have resulted in the same nutrient recommendation quantity.
Table 1. Soil test values from a composite of 12 sample cores along a transect at a targeted location in a field.
Transect | NO3–N | Olsen P | K | Zn | Mn | Fe | Cu |
|---|---|---|---|---|---|---|---|
0 | 3.6 | 2.8 | 54 | 0.4 | 0.3 | 6 | 2 |
20 | 3.9 | 2.7 | 52 | 0.4 | 0.2 | 6 | 1.8 |
40 | 3.5 | 2.6 | 51 | 0.4 | 0.2 | 7 | 1.8 |
60 | 3.5 | 3.2 | 48 | 0.4 | 0.2 | 8 | 1.8 |
80 | 3.1 | 2.5 | 50 | 0.4 | 0.2 | 6 | 1.5 |
100 | 3.4 | 2.6 | 58 | 0.4 | 0.2 | 7 | 1.8 |
120 | 3.4 | 2.7 | 58 | 0.4 | 0.3 | 8 | 2 |
140 | 3.9 | 2.9 | 55 | 0.4 | 0.2 | 7 | 1.7 |
160 | 3.3 | 2.8 | 51 | 0.4 | 0.2 | 7 | 1.7 |
mean | 3.51 | 2.76 | 53.00 | 0.40 | 0.22 | 6.89 | 1.79 |
Std Dev | 0.26 | 0.21 | 3.5 | 0.00 | 0.04 | 0.78 | 0.15 |
Understandably, the information presented here was not necessarily a replicated scientific study, and some statisticians might take exception to my methodology. Nonetheless, it demonstrates in practical fashion the inherent variability associated with soil sampling and underscores the importance of being consistent and careful in soil-sampling procedures.
When soil sampling, it is important to have a clear understanding these principles and their impact on the validity of the soil sample. Also, choosing a sampling tool suited to the soil texture and moisture conditions, which allows you to obtain several uniform (in both depth and diameter) cores, will minimize the challenges associated with trying to represent 36 million plus pounds of soil (10 ac) or whatever acreage your sample intends to represent.
Finally, remember intensive soil sampling associated with precision agriculture helps identify
variability within the field. Using proper techniques at these sampling locations and even when just
composite sampling a field will provide the best possible soil sample for analysis. Remember, the
results can only be meaningful if we begin with a good soil sample.
Self-Study CEU Quiz
Earn 0.5 CEUs in Soil & Water Management by taking the quiz for the article at https://web.sciencesocieties.org/Learning-Center/Courses. For your convenience, the quiz is printed below. The CEU can be purchased individually, or you can access as part of your Online Classroom Subscription.
- Approximately how many million pounds of soil are contained in one acre-foot?
- 36.
- 10.
- 5.
- 3.6.
- According to Figure 1, the results in the soil test dataset used in this article are normally distributed.
- True.
- False.
- How did increasing the number of cores affect the soil test result in Figure 3?
- It did not affect the result.
- It brought it closer to the true mean, 18.5.
- It increased variability.
- It brought it further from the true mean, 18.5.
- In Figure 4, what is the standard deviation when the number of cores is less than 8?
- <1.0.
- 1.0.
- <2.0.
- >2.0.
- What do the author’s exercises in random sampling demonstrate about reducing sampling variability?
- Sample sets containing any less than 80 cores will not reduce sampling variability.
- Sampling 8 or fewer cores will allow for 95.4% of observations to fall within 2.0 standard deviations of the true mean and will reduce sampling variability.
- Sampling 8--20 cores will allow for 95.4% of observations to fall within 2.0 standard deviations of the true mean and will reduce sampling variability.
- It is impossible to reduce sampling variability when doing an Olsen P test.
Text © . The authors. CC BY-NC-ND 4.0. Except where otherwise noted, images are subject to copyright. Any reuse without express permission from the copyright owner is prohibited.


